Living World - Amazon Case Study
The Amazon is the largest tropical rainforest on Earth. It sits within the Amazon River basin, covers some 40% of the South American continent and as you can see on the map below includes parts of eight South American countries: Brazil, Bolivia, Peru, Ecuador, Colombia, Venezuela, Guyana, and Suriname. The actual word “Amazon” comes from river.

Amazing Amazon facts; • It is home to 1000 species of bird and 60,000 species of plants • 10 million species of insects live in the Amazon • It is home to 20 million people, who use the wood, cut down trees for farms and for cattle. • It covers 2.1 million square miles of land • The Amazon is home to almost 20% of species on Earth • The UK and Ireland would fit into the Amazon 17 times!
The Amazon caught the public’s attention in the 1980s when a series of shocking news reports said that an area of rainforest the size of Belgium was being cut down and subsequently burnt every year. This deforestation has continued to the present day according to the Sao Paulo Space Research Centre. In 2005 they had lost 17% of Amazon rainforest or 650000 square kilometres. Their satellite data is also showing increased deforestation in parts of the Amazon. The process of deforestation The Amazon helps a Newly Emerging Economy(NEE), Brazil, to make money. They build roads into the forest, logging firms then go in and take out valuable hard woods such as mahogany and cedar, worth thousands of pounds in richer economies like Europe. Then farmers, often cattle ranchers from big companies, burn the rest to make way for cattle pasture. 75% of cleared areas are used in this way. This is clearly shown on the map on figure 22 in red. Many of the deforested areas follow roads and branch off from there. Deforestation is also worse in the South and South East of the Amazon basin, closer to major centres of population in Brazil.

© WWF Source Used with permission.
The causes of deforestation 1. Subsistence and commercial farming – subsistence farming is where poor farmers occupy plots of the forest to grow food to feed themselves and their families. They clear forest and then burn it, hence the name slash and burn. They grow crops until the soil is exhausted and then move on. This contributes to deforestation but not as much as commercial farming (Farming to sell produce for a profit to retailers or food processing companies). The Brazilian region of Mato Grosso was affected by deforestation in the 1980s and 1990s. 43% of rainforest losses were in this region, and area almost ½ the size of France. It has been replaced by fields for grain and cattle. This has allowed Brazil to overtake Australia as the largest exporter of beef in the world. The land is also flat and easy to farm. It also has high temperatures and lots of rainfall.
2. Logging – This involves cutting down trees for sale as timber or pulp. The timber is used to build homes, furniture, etc. and the pulp is used to make paper and paper products. Logging can be either selective or clear cutting. Selective logging is selective because loggers choose only wood that is highly valued, such as mahogany. Clear-cutting is not selective. Loggers are interested in all types of wood and therefore cut all of the trees down, thus clearing the forest, hence the name- clear-cutting.
3. Road building – trees are also clear for roads. Roads are an essential way for the Brazilian government to allow development of the Amazon rainforest. However, unless they are paved many of the roads are unusable during the wettest periods of the year. The Trans Amazonian Highway has already opened up large parts of the forest and now a new road is going to be paved, the BR163 is a road that runs 1700km from Cuiaba to Santarem. The government planned to tarmac it making it a superhighway. This would make the untouched forest along the route more accessible and under threat from development.
4. Mineral extraction – forests are also cleared to make way for huge mines. The Brazilian part of the Amazon has mines that extract iron, manganese, nickel, tin, bauxite, beryllium, copper, lead, tungsten, zinc and gold!

The Belo Monte dam site under construction, copyright Used with the kind permission of Phil Clarke-Hill - His website is amazing, click here to see it.
5. Energy development – This has focussed mainly on using Hydro Electric Power, and there are 150 new dams planned for the Amazon alone. The dams create electricity as water is passed through huge pipes within them, where it turns a turbine which helps to generate the electricity. The power in the Amazon is often used for mining. Dams displace many people and the reservoirs they create flood large area of land, which would previously have been forest. They also alter the hydrological cycle and trap huge quantities of sediment behind them. The huge Belo Monte dam started operating in April 2016 and will generate over 11,000 Mw of power. A new scheme the 8,000-megawatt São Luiz do Tapajós dam has been held up because of the concerns over the impacts on the local Munduruku people.

6. Settlement & population growth – populations are growing within the Amazon forest and along with them settlements. Many people are migrating to the forest looking for work associated with the natural wealth of this environment. Settlements like Parauapebas, an iron ore mining town, have grown rapidly, destroying forest and replacing it with a swath of shanty towns. The population has grown from 154,000 in 2010 to 220,000 in 2012. The Brazilian Amazon’s population grew by a massive 23% between 2000 and 2010, 11% above the national average.
Impacts of deforestation – economic development, soil erosion, contribution to climate change. • Every time forest is cleared species are lost – so we lose BIODIVERSITY • Climate Change - Burning the forest releases greenhouse gasses like CO2. This contributes to the warming of our planet via climate change and global warming. In addition, the loss of trees prevents CO2 being absorbed, making the problem worse. The Amazon also helps to drive the global atmospheric system. There is a lot of rainfall there and changes to the Amazon could disrupt the global system. • Economic development – Brazil has used the forests as a way to develop their country. The forest has many natural riches that can be exploited. In addition, Brazil has huge foreign debt and lots of poor people to feed, so they want to develop the forest. May Brazilians see deforestation as a way to help develop their country and improve people’s standard of living. • Soil erosion - the soils of the Amazon forest are not fertile and are quickly exhausted once the forest is cleared. The farmers now artificially fertilise the soil when in the past the nutrient cycle would have done this naturally. In addition, the lack of forest cover means that soils are exposed to the rainfall. This washes huge amounts of soil into rivers in the process of soil erosion.
NEXT TOPIC - Living World - Sustainable Forest Management
©2015 Cool Geography
- Copyright Policy
- Privacy & Cookies
- Testimonials
- Feedback & support


Amazon Deforestation and Climate Change
Join Gisele Bundchen when she meets with one of Brazil’s top climate scientists to discuss the complexity of the Amazon rainforest and its connection to Earth’s atmosphere.
Anthropology, Geography
High on a tower overlooking the lush Amazon canopy, Gisele Bundchen and Brazilian climate scientist Antonio Nobre talk about the importance of the rainforest and the impact of cutting down its trees.
As Nobre explains, the rainforest is not only home to an incredible diversity of species, it also has a critical cooling effect on the planet because its trees channel heat high into the atmosphere. In addition, forests absorb and store carbon dioxide (CO 2 ) from the atmosphere—CO 2 that is released back into the atmosphere when trees are cut and burned.
Nobre warns that if deforestation continues at current levels, we are headed for disaster. The Amazon region could become drier and drier, unable to support healthy habitats or croplands.
Find more of this story in the “Fueling the Fire” episode of the National Geographic Channel’s Years of Living Dangerously series.
Transcript (English)
- Growing up in Southern Brazil, my five sisters and I ate meat pretty much every day. It's just part of the culture here. Per capita, Brazilians are one of the top consumers of beef on the planet. Now, with the world's growing appetite for beef, Brazil has also become a major exporter and is aiming to increase its market share, partly by selling to the US, the world's biggest consumer of beef, and to China, where demand for beef has grown 25% in just 10 years. I understand the need to develop and grow, but does that have to come at the expense of the rainforest and the climate? The Amazon Rainforest is about the same size as the continental United States. One-fifth of the world's fresh water runs through it, and it is home to more species of animals and plants than anywhere on Earth. The Amazon represents more than half of the remaining rainforests on the planet. This forest is so vast, but it is not indestructible. To find out what's at stake, I'm going to talk to one of Brazil's top climate scientist, Dr. Antonio Nobre. So Antonio, tell us a little bit about this amazing green carpet of heaven over here.
- Well, most people don't have the opportunity to come from the top of the forest. If you see all this many shades of green as you see here, it's because biodiversity is the essence of this type of forest. Every species of trees has thousands of species of bugs, and also if you get a leaf of one of the species, and you look to the microbes that is sitting on the top of leaf, you find millions of species, millions, and this is all below our radar screen, so to speak, because we don't realize, it's invisible. And the trees are shooting water from the ground, groundwater up high in the sky, and this goes up into the atmosphere and releases the heat out there, and this radiates to space. And this is very important as a mechanism to cool the planet. They're like air conditioners. Open air conditioning, that's what the forest is.
- So in other words, if we lose all these trees, we are losing the air conditioning that cools off the whole planet.
- Not only that.
- Not only that?
- No. The trees are soaking up carbon, you know the pollution that we produce, like carbon dioxide? Yeah, yeah, yeah.
- Burning gasoline in our cars, you release carbon dioxide in the air, or burning coal, and the trees use carbon dioxide as a raw material.
- So the trees are storing all this carbon, so if you come and cut it down and burn it out, does that mean that all that carbon goes up in the air?
- Absolutely. Yeah.
- What would happen if this forest was gone?
- When the forest is destroyed, climate changes, and then forest that's left is damaged as well. And then the forest grows drier and drier and eventually catch fire. So in the extreme, the whole area becomes a desert. And that's what is in store if we deforest. So we have to quit deforestation yesterday, not 2020 or '30. And there is no plan C. You know, you have plan A. Plan A is business as usual. Keep plundering with all the resources and using as if it were infinite. Plan B is what many people are attempting, changing the matrix of energy and using clean sources, stop eating too much meat, and replanting forests If that doesn't work, then we go to plan C. What's plan C? I have no idea.
- Going to another planet.
- But we can't do that.
- We don't have another planet, so either we work with plan B or we're-
- Basically, yeah. We're done, and so plan B has to work. It has to work.
- People have to take accountability, 'cause it can't just be like, I'm leaving over here and whatever happens over there, who cares?
- It's not my problem.
- It's not my problem, because it is everyone's problem.
- Yes. People should wake up. It's like when you're in the midst of an unfolding disaster, what do you do? You panic? No. You move it. Move, move, move, move. That's what we need to do.
Transcripción (Español)
- El año en que vivimos en peligro.
- Cuando era niña en el sur de Brasil, mis cinco hermanas y yo comíamos carne casi todos los días. Es parte de la cultura aquí. Per cápita, los brasileños son uno de los mayores consumidores de carne de res en el planeta. Ahora, con el creciente apetito mundial por la carne de res, Brasil también se ha convertido en un importante exportador y está buscando aumentar su participación en el mercado, en parte vendiendo a los Estados Unidos, el mayor consumidor de carne de res del mundo, y a China, donde la demanda de carne de res ha crecido un 25 % en tan solo 10 años. Entiendo la necesidad de desarrollarse y crecer, pero ¿tiene que ser a expensas de la selva tropical y el clima? La selva amazónica tiene casi el mismo tamaño que los Estados Unidos continentales. Una quinta parte del agua dulce del mundo fluye a través de ella. Y es hogar de más especies de animales y plantas que cualquier otro lugar en la Tierra. El Amazonas representa más de la mitad de las selvas tropicales restantes en el planeta. Estado Mato Grosso, Brasil Esta selva es tan vasta, pero no es indestructible. Para descubrir lo que está en juego, voy a hablar con uno de los principales científicos climáticos de Brasil, el Dr. Antonio Nobre. Antonio, cuéntanos un poco acerca de esta increíble alfombra verde de cielo que tenemos aquí.
- Bueno, la mayoría de las personas no tienen la oportunidad de venir hasta la cima de la selva. Si ves todos los diferentes tonos de verde como estos aquí, es porque la biodiversidad es la esencia de este tipo de selva. Cada especie de árboles tiene miles de especies de insectos, y también si tomas una hoja de una de las especies, y miras a los microbios en la parte superior de la hoja, encuentras millones de especies, millones, y todo esto queda por debajo de nuestro radar, porque no nos damos cuenta, es invisible. Y los árboles están extrayendo agua del subsuelo, hasta lo alto en el cielo, y esto sube a la atmósfera y libera el calor allí, y esto se irradia al espacio. Este es un mecanismo muy importante para enfriar el planeta. Son como aires acondicionados. Aire acondicionado al aire libre, eso es el bosque.
- En otras palabras, si perdemos todos estos árboles, estamos perdiendo el aire acondicionado que enfría todo el planeta.
- No solo eso.
- ¿No solo eso?
- No. Los árboles están absorbiendo carbono, ¿la contaminación que producimos, como el dióxido de carbono?
- Al quemar gasolina en los autos, se libera dióxido de carbono al aire, o quemando carbón, y los árboles usan el dióxido de carbono como materia prima.
- Entonces los árboles están almacenando todo este carbono, así que si lo cortas y lo quemas, ¿eso significa que todo ese carbono sube al aire?
- Absolutamente. Sí.
- ¿Qué pasaría si este bosque desapareciera?
- Cuando el bosque es destruido, el clima cambia, y luego el bosque que queda también se daña. Luego el bosque se vuelve cada vez más seco y eventualmente se incendia. En caso extremo, toda el área se convierte en un desierto. Eso es lo que nos espera si deforestamos. Así que tenemos que dejar de deforestar desde ayer, no en 2020 o 2030. No hay un plan C. Tienes un plan A. El plan A es seguir como siempre. Continuar saqueando todos los recursos y usarlos como si fueran infinitos. El plan B es lo que muchos están intentando, cambiar la matriz de energía y usar fuentes limpias, dejar de comer demasiada carne y reforestar bosques. Si eso no funciona, entonces pasamos al plan C. ¿Cuál es el plan C?
- No tengo idea.
- Ir a otro planeta.
- Pero no podemos hacer eso.
- No tenemos otro planeta, así que o trabajamos con el plan B o estamos-
- Acabados.
- Básicamente, sí. Estamos acabados, así que el plan B tiene que funcionar. Tiene que funcionar.
- Las personas deben asumir responsabilidad, porque no puedes nada más pensar, yo vivo aquí y lo que suceda por allá, ¿a quién le importa?
- A mí qué.
- No es mi problema, porque es un problema de todos.
- Sí. La gente debería despertar. Es como cuando estás en medio de un desastre en desarrollo, ¿qué haces? ¿Entrar en pánico? No. Lo mueves. Que se mueva. Eso es lo que necesitamos hacer.
The Amazon rain forest absorbs one-fourth of the CO2 absorbed by all the land on Earth. The amount absorbed today, however, is 30% less than it was in the 1990s because of deforestation. A major motive for deforestation is cattle ranching. China, the United States, and other countries have created a consumer demand for beef, so clearing land for cattle ranching can be profitable—even if it’s illegal. The demand for pastureland, as well as cropland for food such as soybeans, makes it difficult to protect forest resources.
Many countries are making progress in the effort to stop deforestation. Countries in South America and Southeast Asia, as well as China, have taken steps that have helped reduce greenhouse gas emissions from the destruction of forests by one-fourth over the past 15 years.
Brazil continues to make impressive strides in reducing its impact on climate change. In the past two decades, its CO2 emissions have dropped more than any other country. Destruction of the rain forest in Brazil has decreased from about 19,943 square kilometers (7,700 square miles) per year in the late 1990s to about 5,180 square kilometers (2,000 square miles) per year now. Moving forward, the major challenge will be fighting illegal deforestation.
Articles & Profiles
Instructional links, media credits.
The audio, illustrations, photos, and videos are credited beneath the media asset, except for promotional images, which generally link to another page that contains the media credit. The Rights Holder for media is the person or group credited.
Last Updated
August 20, 2024
User Permissions
For information on user permissions, please read our Terms of Service. If you have questions about how to cite anything on our website in your project or classroom presentation, please contact your teacher. They will best know the preferred format. When you reach out to them, you will need the page title, URL, and the date you accessed the resource.
If a media asset is downloadable, a download button appears in the corner of the media viewer. If no button appears, you cannot download or save the media.
Text on this page is printable and can be used according to our Terms of Service .
Interactives
Any interactives on this page can only be played while you are visiting our website. You cannot download interactives.
Related Resources
- 0 Shopping Cart

Sustainable Management of the Amazon Rainforest
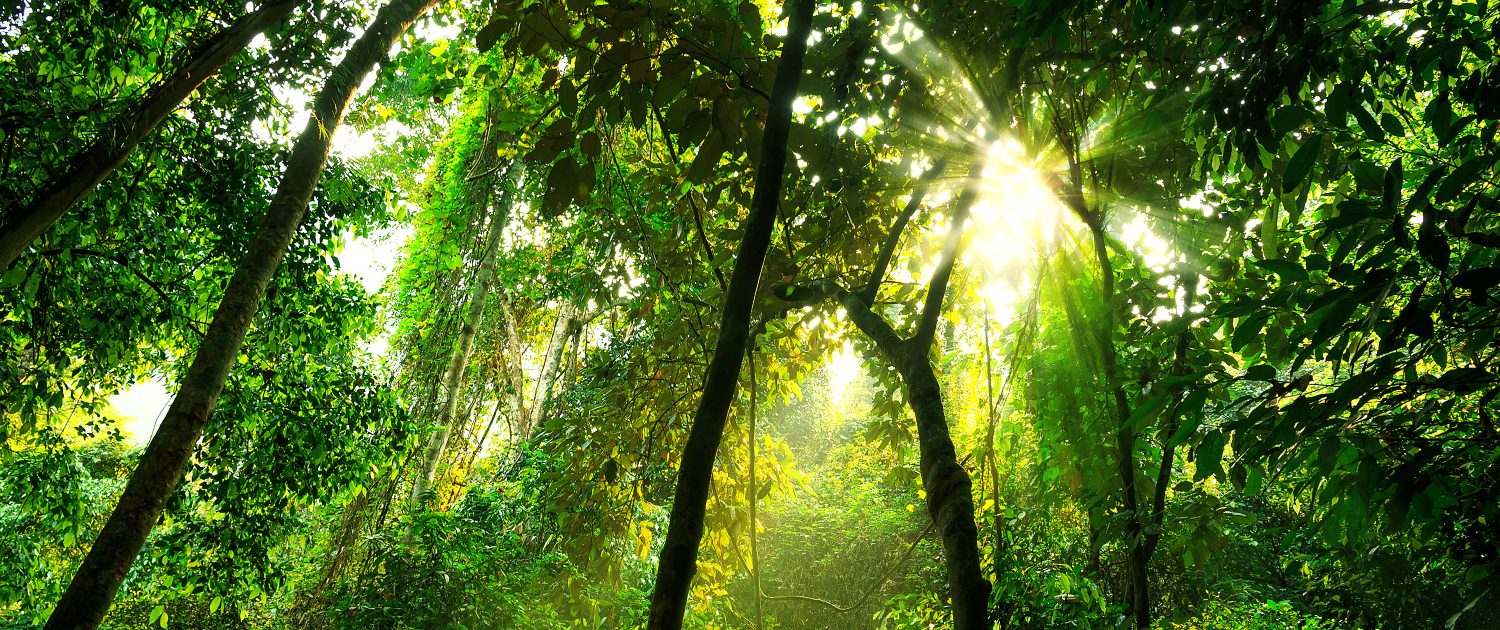
The Amazon rainforest is located in the north of South America, spanning an area of around 8 million km2 including parts of Brazil, Columbia, Peru, Venezuela, Ecuador Bolivia, Suriname, Guyana and French Guyana.
In some areas of the Amazon rainforest, sustainable management strategies are in place to ensure people today can get the resources they need in a way that ensures future generations can also benefit from the ecosystem .
Sustainable management strategies are affected by political and economic factors .
Governance
Governance relates to control of rainforests and who has a say in how rainforests are used. In some areas, rainforests are protected by national and international laws.
In Brazil, the largest protected area of rainforest is the Central Amazon Conservation Complex (CACC) . The CACC covers 60000 km2 as is classified as a World Heritage Site by the United Nations, which means it is protected by international treaties. Limits are placed on hunting , logging and fishing and access is limited.
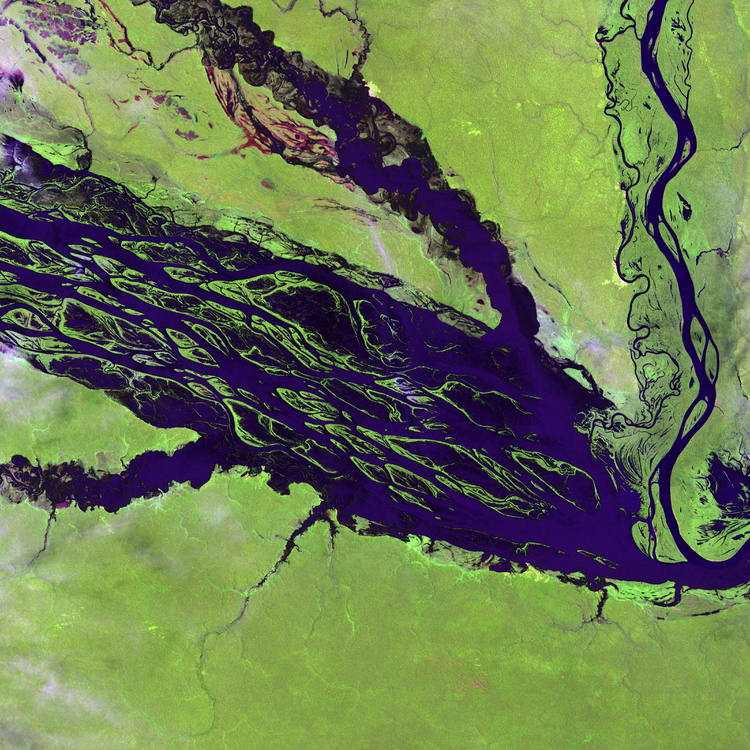
Central Amazon Conservation Complex (CACC)
In other areas local communities, with the help of NGOs, are involved in rainforest governance. In Columbia, an organisation known as Natütama is working with the local community in Puerto Nariño to protect river species such as the Amazon River dolphin. Local people are employed to teach members of the community on how to protect habitats and endangered river species. Local fishermen collect information about the number and distribution of species and report illegal hunting.
Commodity Value
Commodity value means assigning a value to different good and services in a rainforest. Sustainable management ensures rainforests are worth. more than the value of the timber and other resources that can be extracted, such as gold. An example of this is sustainable foresty, which balances the removal of trees to sell with the conservation of the forest.
Selective logging involves only removing a small number of trees, allowing the forest to regenerate naturally. This saves money in the long run as logging companies do not need to replace felled trees.
Sustainable logging companies such as Precious Woods Amazon place limits on the number of trees being cut down so the rainforest can recover. They also use a range of species so that none are over-exploited.
International agreements try to reduce illegal logging and ensure timber comes from sustainable sources. The Forestry Stewardship Council allows the use of its logo by companies that operate in a sustainable way so consumers know they are buying sustainable timber.
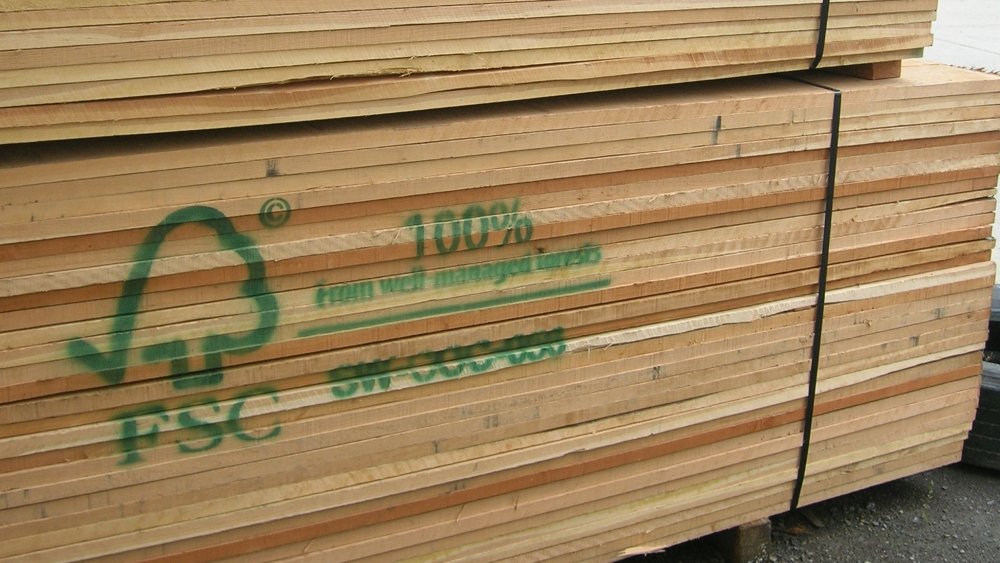
FSC certified wood
Ecotourism is a type of tourism that minimises damage to the environment and benefits local people.
An example of an ecotourism project is the Yachana Lodge in Equador. It is located in a remote area of the Amazon Rainforest where local people rely on subsistence farming.
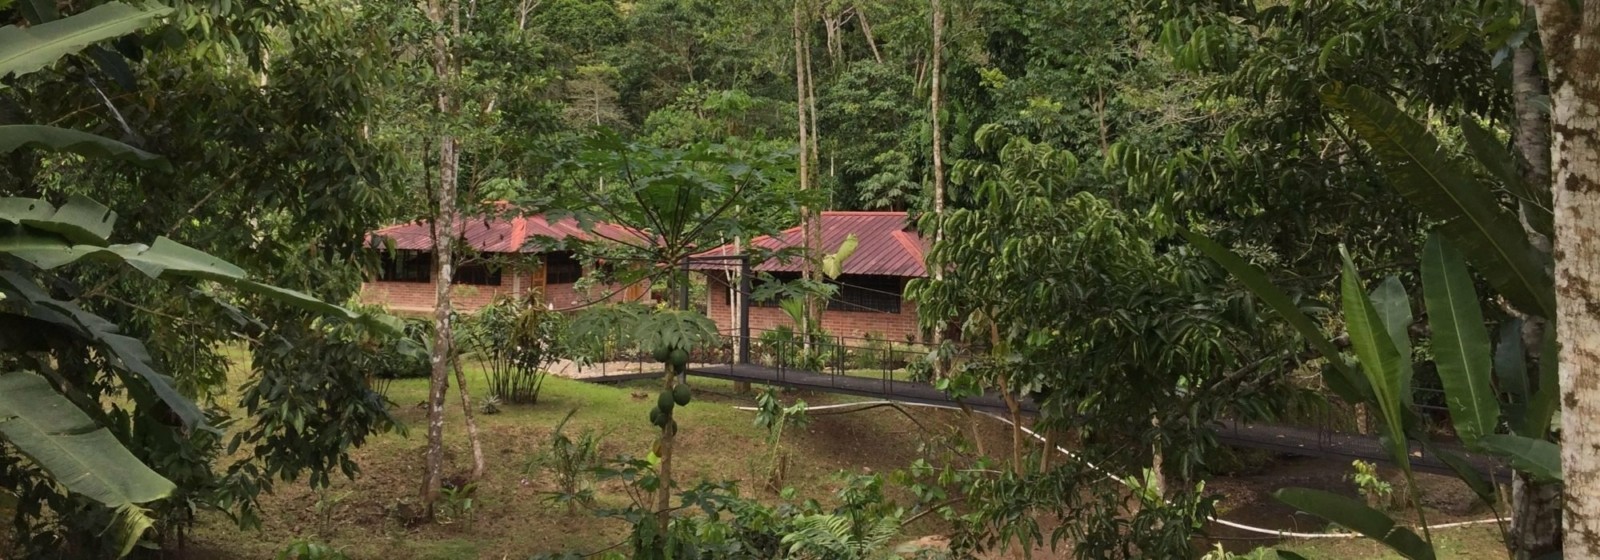
Yachana Lodge
The project employs local people. This provides a reliable source of income and a better quality of life. The project encourages local people to use the rainforest in a sustainable way so tourists continue to visit.
Volunteers work with local Amazon youth who study at the Yachana Technical High School where learning is focused on five main areas:
- Rainforest conservation
- Sustainable agriculture
- Renewable energy
- Animal husbandry
- Micro-enterprise development .
Tourists are only allowed to visit in small groups, minimising their impact on the environment. Tourists take part in activities that help raise awareness of conservation issues.
Entrance fees are paid by the tourists which are invested in conservation and education projects.

Premium Resources
Please support internet geography.
If you've found the resources on this page useful please consider making a secure donation via PayPal to support the development of the site. The site is self-funded and your support is really appreciated.
Related Topics
Use the images below to explore related GeoTopics.
Sustainable Management of the Rainforest
Topic home, share this:.
- Click to share on Twitter (Opens in new window)
- Click to share on Facebook (Opens in new window)
- Click to share on Pinterest (Opens in new window)
- Click to email a link to a friend (Opens in new window)
- Click to share on WhatsApp (Opens in new window)
- Click to print (Opens in new window)
If you've found the resources on this site useful please consider making a secure donation via PayPal to support the development of the site. The site is self-funded and your support is really appreciated.
Search Internet Geography
Latest Blog Entries
Pin It on Pinterest
- Click to share
- Print Friendly
Case Study: Deforestation in the Amazon Rainforest
Deforestation in the amazon rainforest.
The Amazon rainforest area spans about 8,200,000km 2 across 9 countries, making it the largest rainforest in the world. The tree coverage in 1970 was 4.1m km 2 . In 2018, it was 3.3m km 2 . Between 2001 and 2013, the causes of Amazonian deforestation were:
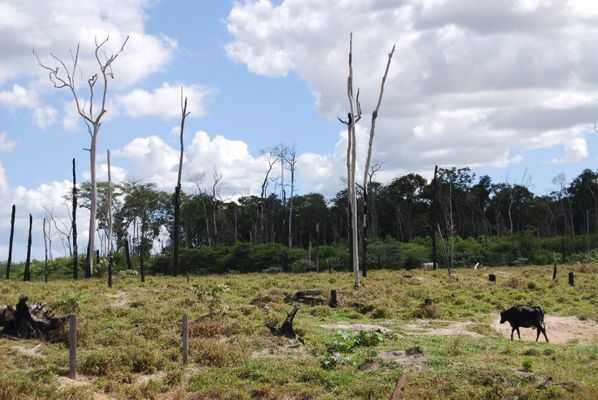
Pasture and cattle ranching = 63%
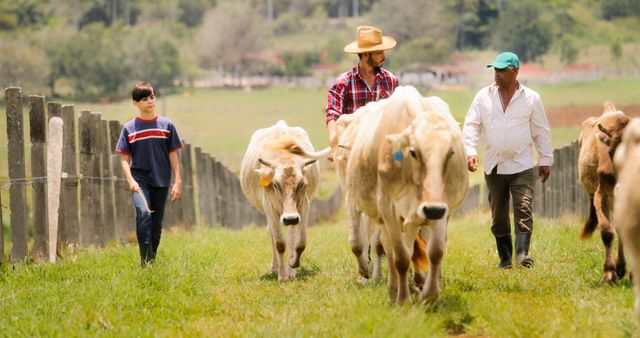
Small-scale, subsistence farmers = 12%

Commercial crop farming = 7%
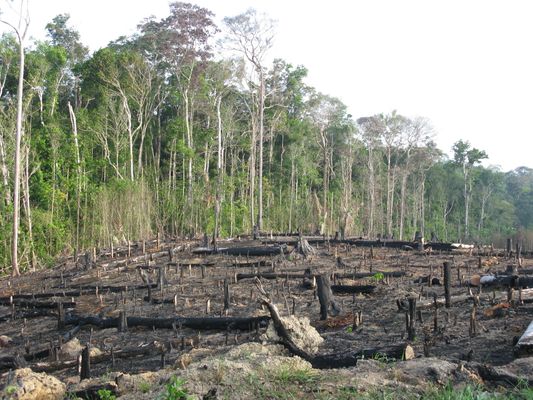
Tree felling and logging = 6%
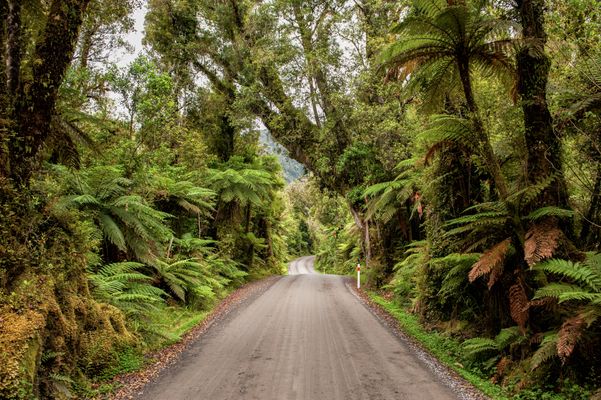
Other activities = 3%
- E.g. plantations, mining, road-building, and construction.
Impacts of Deforestation in the Amazon
Deforestation in the Amazon rainforest has the following environmental and economic impacts:
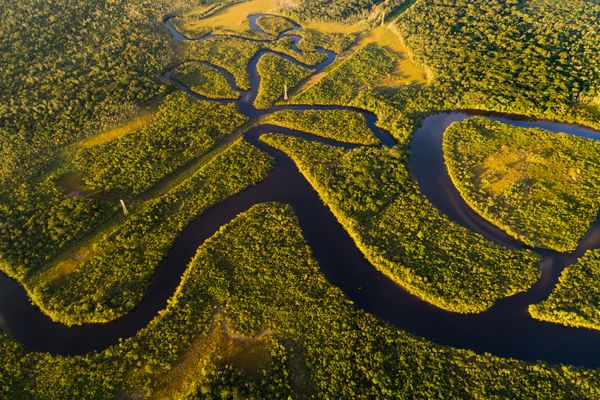
Environmental impact of Amazonian deforestation
- Photosynthesis by trees in the Amazon absorbs 5% of the world's carbon emissions each year (2bn tons of CO2).
- 100 billion tonnes of carbon are stored in the wood of the trees in the Amazon.
- If the Amazon were completely deforested, it would release the 100bn tonnes and also reduce the amount of carbon dioxide taken out of the atmosphere by 2bn tons each year.
- Trees anchor soil in the ground, bound to their roots. Deforestation damages the topsoil and once this has happened, the fertility of the ground is seriously damaged.
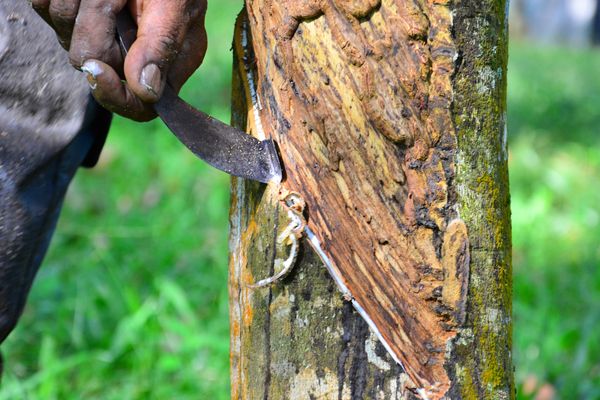
Economic impact of Amazonian deforestation
- Deforestation has fuelled the economic development of poor countries.
- In 2018, Brazil exported $28bn worth of metals. The mining industry creates jobs, exports and helps increase Brazilian people's standard of living.
- Similarly, hydroelectric power plants and cattle farms help to create jobs.
- In 2018, Brazil became the world's largest exporter of beef.
- Rio Tinto, an iron ore mining company employs 47,000 people globally and thousands of these are in Brazil.
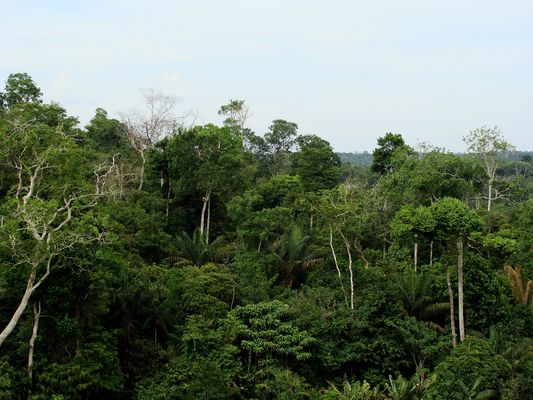
The rate of deforestation in the Amazon
- In 2015, the Brazilian President Dilma Rousseff claimed that the rate of deforestation had fallen by 83% and that actually Brazil was going to reforest the Amazon.
- However, the policies under President Temer and President Bolsonaro has reversed Rousseff's plan. In 2019, under Bolsonaro, the rate of deforestation was increasing again.
1 The Challenge of Natural Hazards
1.1 Natural Hazards
1.1.1 Natural Hazards
1.1.2 Types of Natural Hazards
1.1.3 Factors Affecting Risk
1.1.4 People Affecting Risk
1.1.5 Ability to Cope With Natural Hazards
1.1.6 How Serious Are Natural Hazards?
1.1.7 End of Topic Test - Natural Hazards
1.1.8 Exam-Style Questions - Natural Hazards
1.2 Tectonic Hazards
1.2.1 The Earth's Layers
1.2.2 Tectonic Plates
1.2.3 The Earth's Tectonic Plates
1.2.4 Convection Currents
1.2.5 Plate Margins
1.2.6 Volcanoes
1.2.7 Volcano Eruptions
1.2.8 Effects of Volcanoes
1.2.9 Primary Effects of Volcanoes
1.2.10 Secondary Effects of Volcanoes
1.2.11 Responses to Volcanic Eruptions
1.2.12 Immediate Responses to Volcanoes
1.2.13 Long-Term Responses to Volcanoes
1.2.14 Earthquakes
1.2.15 Earthquakes at Different Plate Margins
1.2.16 What is an Earthquake?
1.2.17 Measuring Earthquakes
1.2.18 Immediate Responses to Earthquakes
1.2.19 Long-Term Responses to Earthquakes
1.2.20 Case Studies: The L'Aquila Earthquake
1.2.21 Case Studies: The Kashmir Earthquake
1.2.22 Earthquake Case Study: Chile 2010
1.2.23 Earthquake Case Study: Nepal 2015
1.2.24 Reducing the Impact of Tectonic Hazards
1.2.25 Protecting & Planning
1.2.26 Living with Tectonic Hazards 2
1.2.27 End of Topic Test - Tectonic Hazards
1.2.28 Exam-Style Questions - Tectonic Hazards
1.2.29 Tectonic Hazards - Statistical Skills
1.3 Weather Hazards
1.3.1 Winds & Pressure
1.3.2 The Global Atmospheric Circulation Model
1.3.3 Surface Winds
1.3.4 UK Weather Hazards
1.3.5 Changing Weather in the UK
1.3.6 Tropical Storms
1.3.7 Tropical Storm Causes
1.3.8 Features of Tropical Storms
1.3.9 The Structure of Tropical Storms
1.3.10 The Effect of Climate Change on Tropical Storms
1.3.11 The Effects of Tropical Storms
1.3.12 Responses to Tropical Storms
1.3.13 Reducing the Effects of Tropical Storms
1.3.14 Tropical Storms Case Study: Katrina
1.3.15 Tropical Storms Case Study: Haiyan
1.3.16 UK Weather Hazards Case Study: Somerset 2014
1.3.17 End of Topic Test - Weather Hazards
1.3.18 Exam-Style Questions - Weather Hazards
1.3.19 Weather Hazards - Statistical Skills
1.4 Climate Change
1.4.1 Climate Change
1.4.2 Evidence for Climate Change
1.4.3 Natural Causes of Climate Change
1.4.4 Human Causes of Climate Change
1.4.5 Effects of Climate Change on the Environment
1.4.6 Effects of Climate Change on People
1.4.7 Climate Change Mitigation Strategies
1.4.8 Adaptation to Climate Change
1.4.9 End of Topic Test - Climate Change
1.4.10 Exam-Style Questions - Climate Change
1.4.11 Climate Change - Statistical Skills
2 The Living World
2.1 Ecosystems
2.1.1 Ecosystems
2.1.2 Food Chains & Webs
2.1.3 Ecosystem Cascades
2.1.4 Global Ecosystems
2.1.5 Ecosystem Case Study: Freshwater Ponds
2.2 Tropical Rainforests
2.2.1 Tropical Rainforests
2.2.2 Interdependence of Tropical Rainforests
2.2.3 Adaptations of Plants to Rainforests
2.2.4 Adaptations of Animals to Rainforests
2.2.5 Biodiversity of Tropical Rainforests
2.2.6 Deforestation
2.2.7 Impacts of Deforestation
2.2.8 Case Study: Deforestation in the Amazon Rainforest
2.2.9 Why Protect Rainforests?
2.2.10 Sustainable Management of Rainforests
2.2.11 Case Study: Malaysian Rainforest
2.2.12 End of Topic Test - Tropical Rainforests
2.2.13 Exam-Style Questions - Tropical Rainforests
2.2.14 Deforestation - Statistical Skills
2.3 Hot Deserts
2.3.1 Hot Deserts
2.3.2 Interdependence in Hot Deserts
2.3.3 Adaptation of Plants to Hot Deserts
2.3.4 Adaptation of Animals to Hot Deserts
2.3.5 Biodiversity in Hot Deserts
2.3.6 Case Study: Sahara Desert
2.3.7 Desertification
2.3.8 Reducing the Risk of Desertification
2.3.9 Case Study: Thar Desert
2.3.10 End of Topic Test - Hot Deserts
2.3.11 Exam-Style Questions - Hot Deserts
2.4 Tundra & Polar Environments
2.4.1 Overview of Cold Environments
2.4.2 Interdependence of Cold Environments
2.4.3 Adaptations of Plants to Cold Environments
2.4.4 Adaptations of Animals to Cold Environments
2.4.5 Biodiversity in Cold Environments
2.4.6 Case Study: Alaska
2.4.7 Sustainable Management
2.4.8 Case Study: Svalbard
2.4.9 End of Topic Test - Tundra & Polar Environments
2.4.10 Exam-Style Questions - Cold Environments
3 Physical Landscapes in the UK
3.1 The UK Physical Landscape
3.1.1 The UK Physical Landscape
3.1.2 Examples of the UK's Landscape
3.2 Coastal Landscapes in the UK
3.2.1 Types of Wave
3.2.2 Weathering
3.2.3 Mass Movement
3.2.4 Processes of Erosion
3.2.5 Wave-Cut Platforms
3.2.6 Headlands & Bays
3.2.7 Caves, Arches & Stacks
3.2.8 Longshore Drift
3.2.9 Sediment Transport
3.2.10 Deposition
3.2.11 Spits, Bars & Sand Dunes
3.2.12 Coastal Management - Hard Engineering
3.2.13 Coastal Management - Soft Engineering
3.2.14 Case Study: Landforms on the Dorset Coast
3.2.15 Coastal Management - Managed Retreat
3.2.16 Coastal Management Case Study - Holderness
3.2.17 Coastal Management Case Study: Swanage
3.2.18 Coastal Management Case Study - Lyme Regis
3.2.19 End of Topic Test - Coastal Landscapes in the UK
3.2.20 Exam-Style Questions - Coasts
3.3 River Landscapes in the UK
3.3.1 The Long Profile of a River
3.3.2 The Cross Profile of a River
3.3.3 Vertical & Lateral Erosion
3.3.4 River Valley Case Study - River Tees
3.3.5 Processes of Erosion
3.3.6 Sediment Transport
3.3.7 River Deposition
3.3.8 Waterfalls & Gorges
3.3.9 Interlocking Spurs
3.3.10 Meanders
3.3.11 Oxbow Lakes
3.3.12 Floodplains
3.3.13 Levees
3.3.14 Estuaries
3.3.15 Case Study: The River Clyde
3.3.16 River Management
3.3.17 Hydrographs
3.3.18 Flood Defences - Hard Engineering
3.3.19 Flood Defences - Soft Engineering
3.3.20 River Management Case Study - Boscastle
3.3.21 River Management Case Study - Banbury
3.3.22 End of Topic Test - River Landscapes in the UK
3.3.23 Exam-Style Questions - Rivers
3.4 Glacial Landscapes in the UK
3.4.1 The UK in the Last Ice Age
3.4.2 Glacial Processes
3.4.3 Glacial Landforms Caused by Erosion
3.4.4 Tarns, Corries, Glacial Troughs & Truncated Spurs
3.4.5 Types of Moraine
3.4.6 Drumlins & Erratics
3.4.7 Snowdonia
3.4.8 Land Use in Glaciated Areas
3.4.9 Conflicts in Glacial Landscapes
3.4.10 Tourism in Glacial Landscapes
3.4.11 Coping with Tourism Impacts in Glacial Landscapes
3.4.12 Case Study - Lake District
3.4.13 End of Topic Test - Glacial Landscapes in the UK
3.4.14 Exam-Style Questions - Glacial Landscapes
4 Urban Issues & Challenges
4.1 Urban Issues & Challenges
4.1.1 Urbanisation
4.1.2 Factors Causing Urbanisation
4.1.3 Megacities
4.1.4 Urbanisation Case Study: Lagos
4.1.5 Urbanisation Case Study: Rio de Janeiro
4.1.6 UK Cities
4.1.7 Case Study: Urban Regen Projects - Manchester
4.1.8 Case Study: Urban Change in Liverpool
4.1.9 Case Study: Urban Change in Bristol
4.1.10 Sustainable Urban Life
4.1.11 Reducing Traffic Congestion
4.1.12 End of Topic Test - Urban Issues & Challenges
4.1.13 Exam-Style Questions - Urban Issues & Challenges
4.1.14 Urban Issues -Statistical Skills
5 The Changing Economic World
5.1 The Changing Economic World
5.1.1 Measuring Development
5.1.2 Limitations of Developing Measures
5.1.3 Classifying Countries Based on Wealth
5.1.4 The Demographic Transition Model
5.1.5 Stages of the Demographic Transition Model
5.1.6 Physical Causes of Uneven Development
5.1.7 Historical Causes of Uneven Development
5.1.8 Economic Causes of Uneven Development
5.1.9 Consequences of Uneven Development
5.1.10 How Can We Reduce the Global Development Gap?
5.1.11 Case Study: Tourism in Kenya
5.1.12 Case Study: Tourism in Jamaica
5.1.13 Case Study: Economic Development in India
5.1.14 Case Study: Aid & Development in India
5.1.15 Case Study: Economic Development in Nigeria
5.1.16 Case Study: Aid & Development in Nigeria
5.1.17 End of Topic Test - The Changing Economic World
5.1.18 Exam-Style Questions - The Changing Economic World
5.1.19 Changing Economic World - Statistical Skills
5.2 Economic Development in the UK
5.2.1 Causes of Economic Change in the UK
5.2.2 The UK's Post-Industrial Economy
5.2.3 The Impacts of UK Industry on the Environment
5.2.4 Change in the UK's Rural Areas
5.2.5 Transport in the UK
5.2.6 The North-South Divide
5.2.7 Regional Differences in the UK
5.2.8 The UK's Links to the World
6 The Challenge of Resource Management
6.1 Resource Management
6.1.1 Global Distribution of Resources
6.1.2 Uneven Distribution of Resources
6.1.3 Food in the UK
6.1.4 Agribusiness
6.1.5 Demand for Water in the UK
6.1.6 Water Pollution in the UK
6.1.7 Matching Supply & Demand of Water in the UK
6.1.8 The UK's Energy Mix
6.1.9 Issues with Sources of Energy
6.1.10 Resource Management - Statistical Skills
6.2.1 Areas of Food Surplus & Food Deficit
6.2.2 Increasing Food Consumption
6.2.3 Food Supply & Food Insecurity
6.2.4 Impacts of Food Insecurity
6.2.5 Increasing Food Supply
6.2.6 Case Study: Thanet Earth
6.2.7 Creating a Sustainable Food Supply
6.2.8 Case Study: Agroforestry in Mali
6.2.9 End of Topic Test - Food
6.2.10 Exam-Style Questions - Food
6.2.11 Food - Statistical Skills
6.3.1 Water Surplus & Water Deficit
6.3.2 Increasing Water Consumption
6.3.3 What Affects the Availability of Water?
6.3.4 Impacts of Water Insecurity
6.3.5 Increasing Water Supplies
6.3.6 Case Study: Water Transfer in China
6.3.7 Sustainable Water Supply
6.3.8 Case Study: Kenya's Sand Dams
6.3.9 Case Study: Lesotho Highland Water Project
6.3.10 Case Study: Wakel River Basin Project
6.3.11 Exam-Style Questions - Water
6.3.12 Water - Statistical Skills
6.4.1 Global Demand for Energy
6.4.2 Increasing Energy Consumption
6.4.3 Factors Affecting Energy Supply
6.4.4 Impacts of Energy Insecurity
6.4.5 Increasing Energy Supply - Solar
6.4.6 Increasing Energy Supply - Water
6.4.7 Increasing Energy Supply - Wind
6.4.8 Increasing Energy Supply - Nuclear
6.4.9 Increasing Energy Supply - Fossil Fuels
6.4.10 Carbon Footprints
6.4.11 Energy Conservation
6.4.12 Case Study: Rice Husks in Bihar
6.4.13 Exam-Style Questions - Energy
6.4.14 Energy - Statistical Skills
Jump to other topics

Unlock your full potential with GoStudent tutoring
Affordable 1:1 tutoring from the comfort of your home
Tutors are matched to your specific learning needs
30+ school subjects covered
Impacts of Deforestation
Why Protect Rainforests?
Deforestation, warming flip part of Amazon forest from carbon sink to source
- July 14, 2021
- Download Cover Image
The study area, which represents about 20 percent of the Amazon basin, has lost 30 percent of its rainforest
New results from a nine-year research project in the eastern Amazon rainforest finds that significant deforestation in eastern and southeastern Brazil has been associated with a long-term decrease in rainfall and increase in temperature during the dry season, turning what was once a forest that absorbed carbon dioxide into a source of planet-warming carbon dioxide emissions.
The study, published in the journal Nature , explored whether these changes had altered how much carbon the Amazon stored in its vast forests.
“Using nearly 10 years of CO 2 (carbon dioxide ) measurements, we found that the more deforested and climate-stressed eastern Amazon, especially the southeast, was a net emitter of CO 2 to the atmosphere, especially as a result of fires,” said John Miller, a scientist with NOAA’s Global Monitoring Laboratory and a co-author. “On the other hand, the wetter, more intact western and central Amazon, was neither a carbon sink nor source of atmospheric CO 2 , with the absorption by healthy forests balancing the emissions from fires.”
In addition to storing vast amounts of carbon, Amazonia is also one of the wettest places on Earth, storing immense amounts of water in its soils and vegetation. Transpired by leaves, this moisture evaporates into the atmosphere, where it fuels prodigious rainfall, averaging more than seven feet per year across the basin. For comparison the average annual rainfall in the contiguous U.S. is two and half feet. Several studies have estimated that water cycling through evaporation is responsible for 25 to 35 percent of total rainfall in the basin.
But deforestation and global warming over the last 40 years have affected rainfall and temperature with potential impacts for the Amazon’s ability to store carbon. Conversion of rainforest to agriculture has caused a 17 percent decrease in forest extent in the Amazon, which stretches over an area almost as large as the continental U.S.. Replacing dense, humid forest canopies with drier pastures and cropland has increased local temperatures and decreased evaporation of water from the rainforest, which deprives downwind locations of rainfall. Regional deforestation and selective logging of adjacent forests further reduces forest cover, amplifying the cycle of drying and warming. This, in turn, can reduce the capacity of the forests to store carbon, and increase their vulnerability to fires.
The 2.8 million square miles of jungle in the Amazon basin represents more than half of the tropical rainforest remaining on the planet. The Amazon is estimated to contain about 123 billion tons of carbon above and below ground, and is one of Earth’s most important terrestrial carbon reserves. As global fossil-fuel burning has risen, the Amazon has absorbed CO 2 from the atmosphere, helping to moderate global climate. But there are indications from this study and previous ones that the Amazon’s capacity to act as a sink may be disappearing.
Over the past several decades, intense scientific interest has focused on the question of whether the combined effects of climate change and the ongoing conversion of jungle to pasture and cropland could cause the Amazon to release more carbon dioxide than it absorbs.
In 2010, lead author Luciana Gatti, who led the international team of scientists from Brazil, the United Kingdom, New Zealand and the Netherlands, set out to explore this question. During the next nine years, Gatti, a scientist with Brazil’s National Institute for Space Research and colleagues obtained airborne measurements of CO 2 and carbon monoxide concentrations above Brazilian Amazonia. Analysis of CO 2 measurements from over 600 aircraft vertical profiles, extending from the surface to around 2.8 miles above sea level at four sites, revealed that total carbon emissions in eastern Amazonia are greater than those in the west.
“The regions of southern Pará and northern Mato Grosso states represent a worst-case scenario,” said Gatti.
The southeast region, which represents about 20 percent of the Amazon basin, and has experienced 30 percent deforestation over the previous 40 years. Scientists recorded a 25 percent reduction in precipitation and a temperature increase of at least 2.7 degrees Fahrenheit during the dry months of August, September and October, when trees are already under seasonal stress. Airborne measurements over nine years revealed this region was a net emitter of carbon, mainly as a result of fires, while areas further west, where less than 20 percent of the forest had been removed, sources balanced sinks. The scientists said the increased emissions were likely due to conversion of forest to cropland by burning, and by reduced uptake of CO 2 by the trees that remained.
These findings help scientists better understand the long-term impacts of interactions between climate and human disturbances on the carbon balance of the world’s largest tropical forest.
“The big question this research raises is if the connection between climate, deforestation, and carbon that we see in the eastern Amazon could one day be the fate of the central and western Amazon, if they become subject to stronger human impact,” Miller said. Changes in the capacity of tropical forests to absorb carbon will require downward adjustments of the fossil fuel emissions compatible with limiting global mean temperature increases to less than 2.0 or 1.5 degrees Celsius, he added.
This research was supported by NOAA’s Global Monitoring Laboratory and by funding from the State of Sao Paulo Science Foundation, UK Environmental Research Council, NASA, and the European Research Council.
For more information, contact Theo Stein, NOAA Communications: [email protected]
New ocean acidification maps of U.S. waters

Biden-Harris Administration, NOAA issue National Heat Strategy, provide $200K for extreme heat preparedness

Why is the North Pacific warming so fast?

NOAA and United Airlines partner to measure greenhouse gases, pollutants with high-tech flight instruments
Popup call to action.
A prompt with more information on your call to action.

Want to create or adapt books like this? Learn more about how Pressbooks supports open publishing practices.
73 Case Study: The Amazon Rainforest
The amazon in context.
Tropical rainforests are often considered to be the “cradles of biodiversity.” Though they cover only about 6% of the Earth’s land surface, they are home to over 50% of global biodiversity. Rain forests also take in massive amounts of carbon dioxide and release oxygen through photosynthesis, which has also given them the nickname “lungs of the planet.” They also store very large amounts of carbon, and so cutting and burning their biomass contributes to global climate change. Many modern medicines are derived from rainforest plants, and several very important food crops originated in the rainforest, including bananas, mangos, chocolate, coffee, and sugar cane.
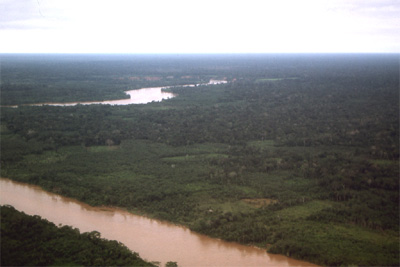
In order to qualify as a tropical rainforest, an area must receive over 250 centimeters of rainfall each year and have an average temperature above 24 degrees centigrade, as well as never experiencing frosts. The Amazon rainforest in South America is the largest in the world. The second largest is the Congo in central Africa, and other important rainforests can be found in Central America, the Caribbean, and Southeast Asia. Brazil contains about 40% of the world’s remaining tropical rainforest. Its rainforest covers an area of land about 2/3 the size of the continental United States.
There are countless reasons, both anthropocentric and ecocentric, to value rainforests. But they are one of the most threatened types of ecosystems in the world today. It’s somewhat difficult to estimate how quickly rainforests are being cut down, but estimates range from between 50,000 and 170,000 square kilometers per year. Even the most conservative estimates project that if we keep cutting rainforests as we are today, within about 100 years there will be none left.
How does a rainforest work?
Rainforests are incredibly complex ecosystems, but understanding a few basics about their ecology will help us understand why clear-cutting and fragmentation are such destructive activities for rainforest biodiversity.
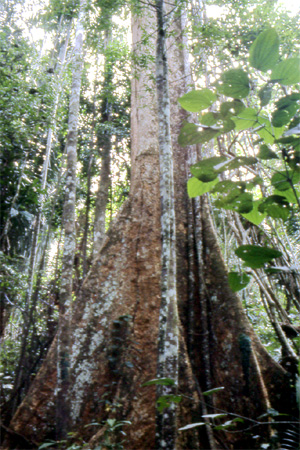
High biodiversity in tropical rainforests means that the interrelationships between organisms are very complex. A single tree may house more than 40 different ant species, each of which has a different ecological function and may alter the habitat in distinct and important ways. Ecologists debate about whether systems that have high biodiversity are stable and resilient, like a spider web composed of many strong individual strands, or fragile, like a house of cards. Both metaphors are likely appropriate in some cases. One thing we can be certain of is that it is very difficult in a rainforest system, as in most others, to affect just one type of organism. Also, clear cutting one small area may damage hundreds or thousands of established species interactions that reach beyond the cleared area.
Pollination is a challenge for rainforest trees because there are so many different species, unlike forests in the temperate regions that are often dominated by less than a dozen tree species. One solution is for individual trees to grow close together, making pollination simpler, but this can make that species vulnerable to extinction if the one area where it lives is clear cut. Another strategy is to develop a mutualistic relationship with a long-distance pollinator, like a specific bee or hummingbird species. These pollinators develop mental maps of where each tree of a particular species is located and then travel between them on a sort of “trap-line” that allows trees to pollinate each other. One problem is that if a forest is fragmented then these trap-line connections can be disrupted, and so trees can fail to be pollinated and reproduce even if they haven’t been cut.
The quality of rainforest soils is perhaps the most surprising aspect of their ecology. We might expect a lush rainforest to grow from incredibly rich, fertile soils, but actually, the opposite is true. While some rainforest soils that are derived from volcanic ash or from river deposits can be quite fertile, generally rainforest soils are very poor in nutrients and organic matter. Rainforests hold most of their nutrients in their live vegetation, not in the soil. Their soils do not maintain nutrients very well either, which means that existing nutrients quickly “leech” out, being carried away by water as it percolates through the soil. Also, soils in rainforests tend to be acidic, which means that it’s difficult for plants to access even the few existing nutrients. The section on slash and burn agriculture in the previous module describes some of the challenges that farmers face when they attempt to grow crops on tropical rainforest soils, but perhaps the most important lesson is that once a rainforest is cut down and cleared away, very little fertility is left to help a forest regrow.
What is driving deforestation in the Amazon?
Many factors contribute to tropical deforestation, but consider this typical set of circumstances and processes that result in rapid and unsustainable rates of deforestation. This story fits well with the historical experience of Brazil and other countries with territory in the Amazon Basin.
Population growth and poverty encourage poor farmers to clear new areas of rainforest, and their efforts are further exacerbated by government policies that permit landless peasants to establish legal title to land that they have cleared.
At the same time, international lending institutions like the World Bank provide money to the national government for large-scale projects like mining, construction of dams, new roads, and other infrastructure that directly reduces the forest or makes it easier for farmers to access new areas to clear.
The activities most often encouraging new road development are timber harvesting and mining. Loggers cut out the best timber for domestic use or export, and in the process knock over many other less valuable trees. Those trees are eventually cleared and used for wood pulp, or burned, and the area is converted into cattle pastures. After a few years, the vegetation is sufficiently degraded to make it not profitable to raise cattle, and the land is sold to poor farmers seeking out a subsistence living.
Regardless of how poor farmers get their land, they often are only able to gain a few years of decent crop yields before the poor quality of the soil overwhelms their efforts, and then they are forced to move on to another plot of land. Small-scale farmers also hunt for meat in the remaining fragmented forest areas, which reduces the biodiversity in those areas as well.
Another important factor not mentioned in the scenario above is the clearing of rainforest for industrial agriculture plantations of bananas, pineapples, and sugar cane. These crops are primarily grown for export, and so an additional driver to consider is consumer demand for these crops in countries like the United States.
These cycles of land use, which are driven by poverty and population growth as well as government policies, have led to the rapid loss of tropical rainforests. What is lost in many cases is not simply biodiversity, but also valuable renewable resources that could sustain many generations of humans to come. Efforts to protect rainforests and other areas of high biodiversity is the topic of the next section.
Introduction to Geography Copyright © by Petra Tschakert; Karl Zimmerer; Brian King; Seth Baum; and Chongming Wang is licensed under a Creative Commons Attribution-NonCommercial-ShareAlike 4.0 International License , except where otherwise noted.
Share This Book
Ask an Amazon Expert: Why We Can't Afford to Lose the Rainforest
Scientist and National Geographic Fellow Dr. Thomas Lovejoy is leading a charge to combat deforestation and protect the Amazon.
Biology, Ecology, Geography
Loading ...

It’s estimated that roughly 20 percent of the Amazon Rainforest has disappeared during the past 50 years. Deforestation due to agriculture , urbanization , and illegal logging is not only threatening the millions of unique plant and animal species native to the Amazon River region, it’s affecting humans worldwide. Whether it’s extreme drought in São Paulo, Brazil, the multibillion-dollar illegal wildlife trade, or the catastrophic impacts of climate change , threats to the Amazon are having a very tangible ripple effect around the globe. The good news is that some of the world’s most accomplished scientists are backing a big push to save the forest. We sat down with one of those scientists—National Geographic Explorer Dr. Thomas Lovejoy—to talk about the state of the Amazon and why conservation matters. NG: You’ve worked in the Amazon for more than 50 years. How have you seen the region change? TL : In the 1960s, there was only one highway in the entire Amazon Basin . That’s an area as large as the continental United States with one highway and three million people. Today, there are between 30 million to 40 million people, countless roads, and it’s about 20 percent deforested. But on the plus side, 50 years ago there were only two national parks in Venezuela, and a national forest and an Indigenous reserve in Brazil. Today, more than 50 percent of the Amazon is under some form of protection. The real challenge is to move toward a much more integrated approach to planning and managing the Amazon. When we talk about conservation of the Amazon, it’s hard for many people to relate because they don’t feel connected to the region. How can we change that? There are actually a lot of direct connections between our daily lives and the Amazon, no matter how far away we are. For example, there’s a big, nasty viper called the bushmaster that lives in the Amazon. This snake kills its prey with venom that causes the prey’s blood pressure to go to zero. Scientists in São Paulo discovered that this venom actually works by affecting a previously unknown system in the body called the angiotensin system. This discovery then allowed pharmaceutical chemists to design the first ACE inhibitor medicines . Today, millions of people use these medicines to treat high blood pressure. They have longer, fuller, and more productive lives, and they have the venom of a nasty snake far away in the Amazon to thank for it. A connection that affects everyone on the planet is climate change. Reforestation is essentially a way of removing excess carbon dioxide from the atmosphere . The existing forest is absorbing some carbon dioxide already. In terms of the global carbon cycle , tropical forests have a carbon sink roughly equal to half of what is in the atmosphere. About half of that is in the Amazon. This means to lose the Amazon would dramatically increase climate change. And there are some extraordinary local connections as well. The Amazon basically makes half of its own rainfall. Moisture comes in off the Atlantic Ocean, falls as rain in the Amazon forest, and about three-quarters of it evaporates back into the atmosphere. This then gets carried west and most of it turns into rain again closer to the Andes Mountains, where it falls and feeds the Amazon river system . This system holds about 20 percent of the world’s river water, which is huge. What isn’t rained out of the Andes disperses north and south, with the southern portion being really important for agriculture in Brazil and Argentina. So, São Paulo’s current drought—possibly the worst in its history—is happening partly because the region is getting less rainfall from the Amazon. What is your vision for the future of the Amazon? There’s been a lot of damage done and forest lost, but nothing is gone until it’s gone. A lot of the negative buzz out there—like the initial projection of species extinctions that I made in 1980—is made in the hope that it will in fact turn out to be a lot less because you’ve gotten people’s attention. Ideally what we hope is for the Amazon to return to be about 90% of the extent of its original forest, and for it to be managed collectively by the nine Amazon nations (Brazil, Peru, Colombia, Venezuela, Ecuador, Bolivia, Guyana, Suriname, and French Guiana). We want to see more integrated planning between the people in charge of transportation , energy , agriculture, and the other industries in the region. We think Amazon cities can have higher quality of life and keep people in existing cities so there’s less reason to deforest.
The Birthplace of Biodiversity There’s a reason scientists working in the Amazon had to come up with a term to describe the incredible wealth of plant and animal species present in the Amazon basin. The region is home to one in ten species known on Earth.
Carbon Contributor? While the Amazon is currently a carbon sink—meaning it stores carbon dioxide that would otherwise contribute to climate change—that might be changing. The World Wildlife Fund states that forest loss and reduced rainfall may turn the Amazon into a net source rather than capturer of carbon emissions.
Articles & Profiles
Media credits.
The audio, illustrations, photos, and videos are credited beneath the media asset, except for promotional images, which generally link to another page that contains the media credit. The Rights Holder for media is the person or group credited.
Last Updated
August 21, 2024
User Permissions
For information on user permissions, please read our Terms of Service. If you have questions about how to cite anything on our website in your project or classroom presentation, please contact your teacher. They will best know the preferred format. When you reach out to them, you will need the page title, URL, and the date you accessed the resource.
If a media asset is downloadable, a download button appears in the corner of the media viewer. If no button appears, you cannot download or save the media.
Text on this page is printable and can be used according to our Terms of Service .
Interactives
Any interactives on this page can only be played while you are visiting our website. You cannot download interactives.
Related Resources

January 27, 2023
One Third of the Amazon Has Been Degraded by Human Activities
A pair of studies raise concerns that the Amazon rain forest may be approaching a point of no return
By Chelsea Harvey & E&E News
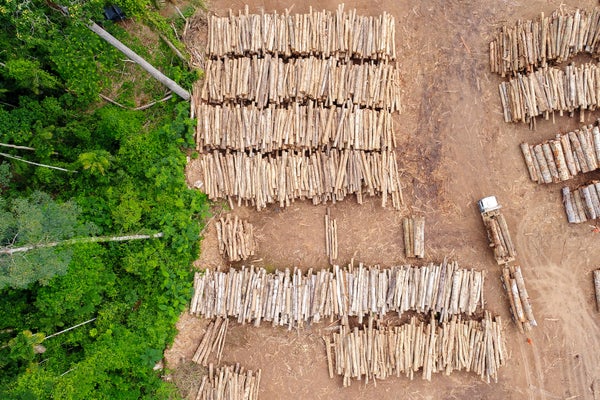
Aerial view of a log storage yard in an area of the Brazilian Amazon rainforest.
Tarcisio Schnaider/Getty Images
Study after study has sounded the alarm on the deteriorating Amazon rainforest. Plagued by deforestation, drought, fires and other human disturbances, the iconic ecosystem is teetering on a dangerous precipice, scientists warn.
New research is once again driving the point home. A pair of studies published this week in the journal Science conclude that the mighty Amazon is swiftly transforming—and it may be at risk of collapsing into a new kind of ecosystem altogether.
Human disturbances have degraded more than a third of the Amazon rainforest, the first study finds. Fires; selective logging; habitat fragmentation; and drought, which is worsened by climate change, are all chipping away at one of the world’s most iconic ecosystems.
On supporting science journalism
If you're enjoying this article, consider supporting our award-winning journalism by subscribing . By purchasing a subscription you are helping to ensure the future of impactful stories about the discoveries and ideas shaping our world today.
That’s to say nothing of the forest that’s been clearcut in recent decades.
The first study focuses only on degradation, activities that damage the forest but don’t remove all the trees from the landscape. It doesn’t include deforestation, which clears a forest area. That’s another problem entirely, with recent estimates suggesting that as much as 17 percent of the Amazon has already been cleared.
Degradation tends to get less attention than deforestation, the researchers note. But it’s still a serious threat. Even though trees remain standing, degraded forests are often less resilient to future disturbances. This puts them at greater risk of dying and transforming into different kinds of ecosystems, like grasslands. Degraded forests also tend to store less carbon.
The researchers used satellite data to estimate the extent of forest area affected by four major disturbances: droughts; fires; timber extraction, when trees are selectively logged from inside the forest without clearing the entire landscape; and “edge effects,” which is when the edges of a forest become more vulnerable to disturbances. Edge effects are common in forests that have been broken up into smaller and smaller pieces over time, with more edges overlapping roads, agricultural lands and other human disruptions.
They found that 38 percent of the remaining Amazonian forests are suffering from some form of degradation.
Often, multiple different disturbances act on the same tract, the study finds. About 5.5 percent of the Amazon is suffering from the combined effects of timber extraction, fire and edge effects at once.
The second study underscores the powerful impact of human activity in the Amazon. It finds that human disturbances are altering the ecosystem hundreds to thousands of times faster than natural processes change the landscape.
The study pulls much of its data from a recent assessment report compiled by the Science Panel for the Amazon, an initiative convened by the United Nations' Sustainable Development Solutions Network. It notes that about 17 percent of the original Amazon has already been deforested. About 14 percent has been converted into agricultural land.
“As we approach an irreversible tipping point for Amazonia, the global community must act now,” the authors of the second study wrote. “To fail the Amazon is to fail the biosphere, and we fail to act at our own peril.”
Scientists have warned repeatedly that the collapse of the Amazon rainforest ecosystem would be a global catastrophe. The Amazon is among the most biodiverse ecosystems on Earth, estimated to contain at least 10 percent of all the world’s plant and vertebrate animal species in one place.
It also contains vast stores of carbon, locked up in its trees and soil. Research estimates that the entire Amazon ecosystem may contain as much as 180 billion tons of carbon — that's about a quarter of all the carbon that's entered the atmosphere since the Industrial Revolution began. As the Amazon degrades, it releases more carbon into the atmosphere, which hastens the progression of global climate change.
Research says that parts of the Amazon are already flipping from carbon sinks to carbon sources, meaning they emit more carbon into the atmosphere than they absorb.
As the ecosystem continues to degrade, scientists say that it may eventually reach a tipping point — a kind of threshold beyond which the Amazon can no longer recover from its disturbances. After this tipping point, the Amazon may transform from a lush rainforest into a grassy savanna — a drier and much less biodiverse kind of ecosystem.
It’s been difficult for scientists to find the precise location of this tipping point. But another recent study warned that it could be approaching faster than expected. It finds that the Amazon has been steadily losing its resilience — its ability to recover from disturbances — for at least 20 years ( Climatewire , March 8, 2022).
Reprinted from E&E News with permission from POLITICO, LLC. Copyright 2023. E&E News provides essential news for energy and environment professionals.
Explainer: Causes and consequences of Amazon fires and deforestation
- Medium Text
WHAT CAUSES THE FIRES?
Why are brazil's fires so bad at this time of year, is climate change affecting amazon forest fires, have brazil's fires been worse than usual in recent years, how much worse is forest loss since 2019.
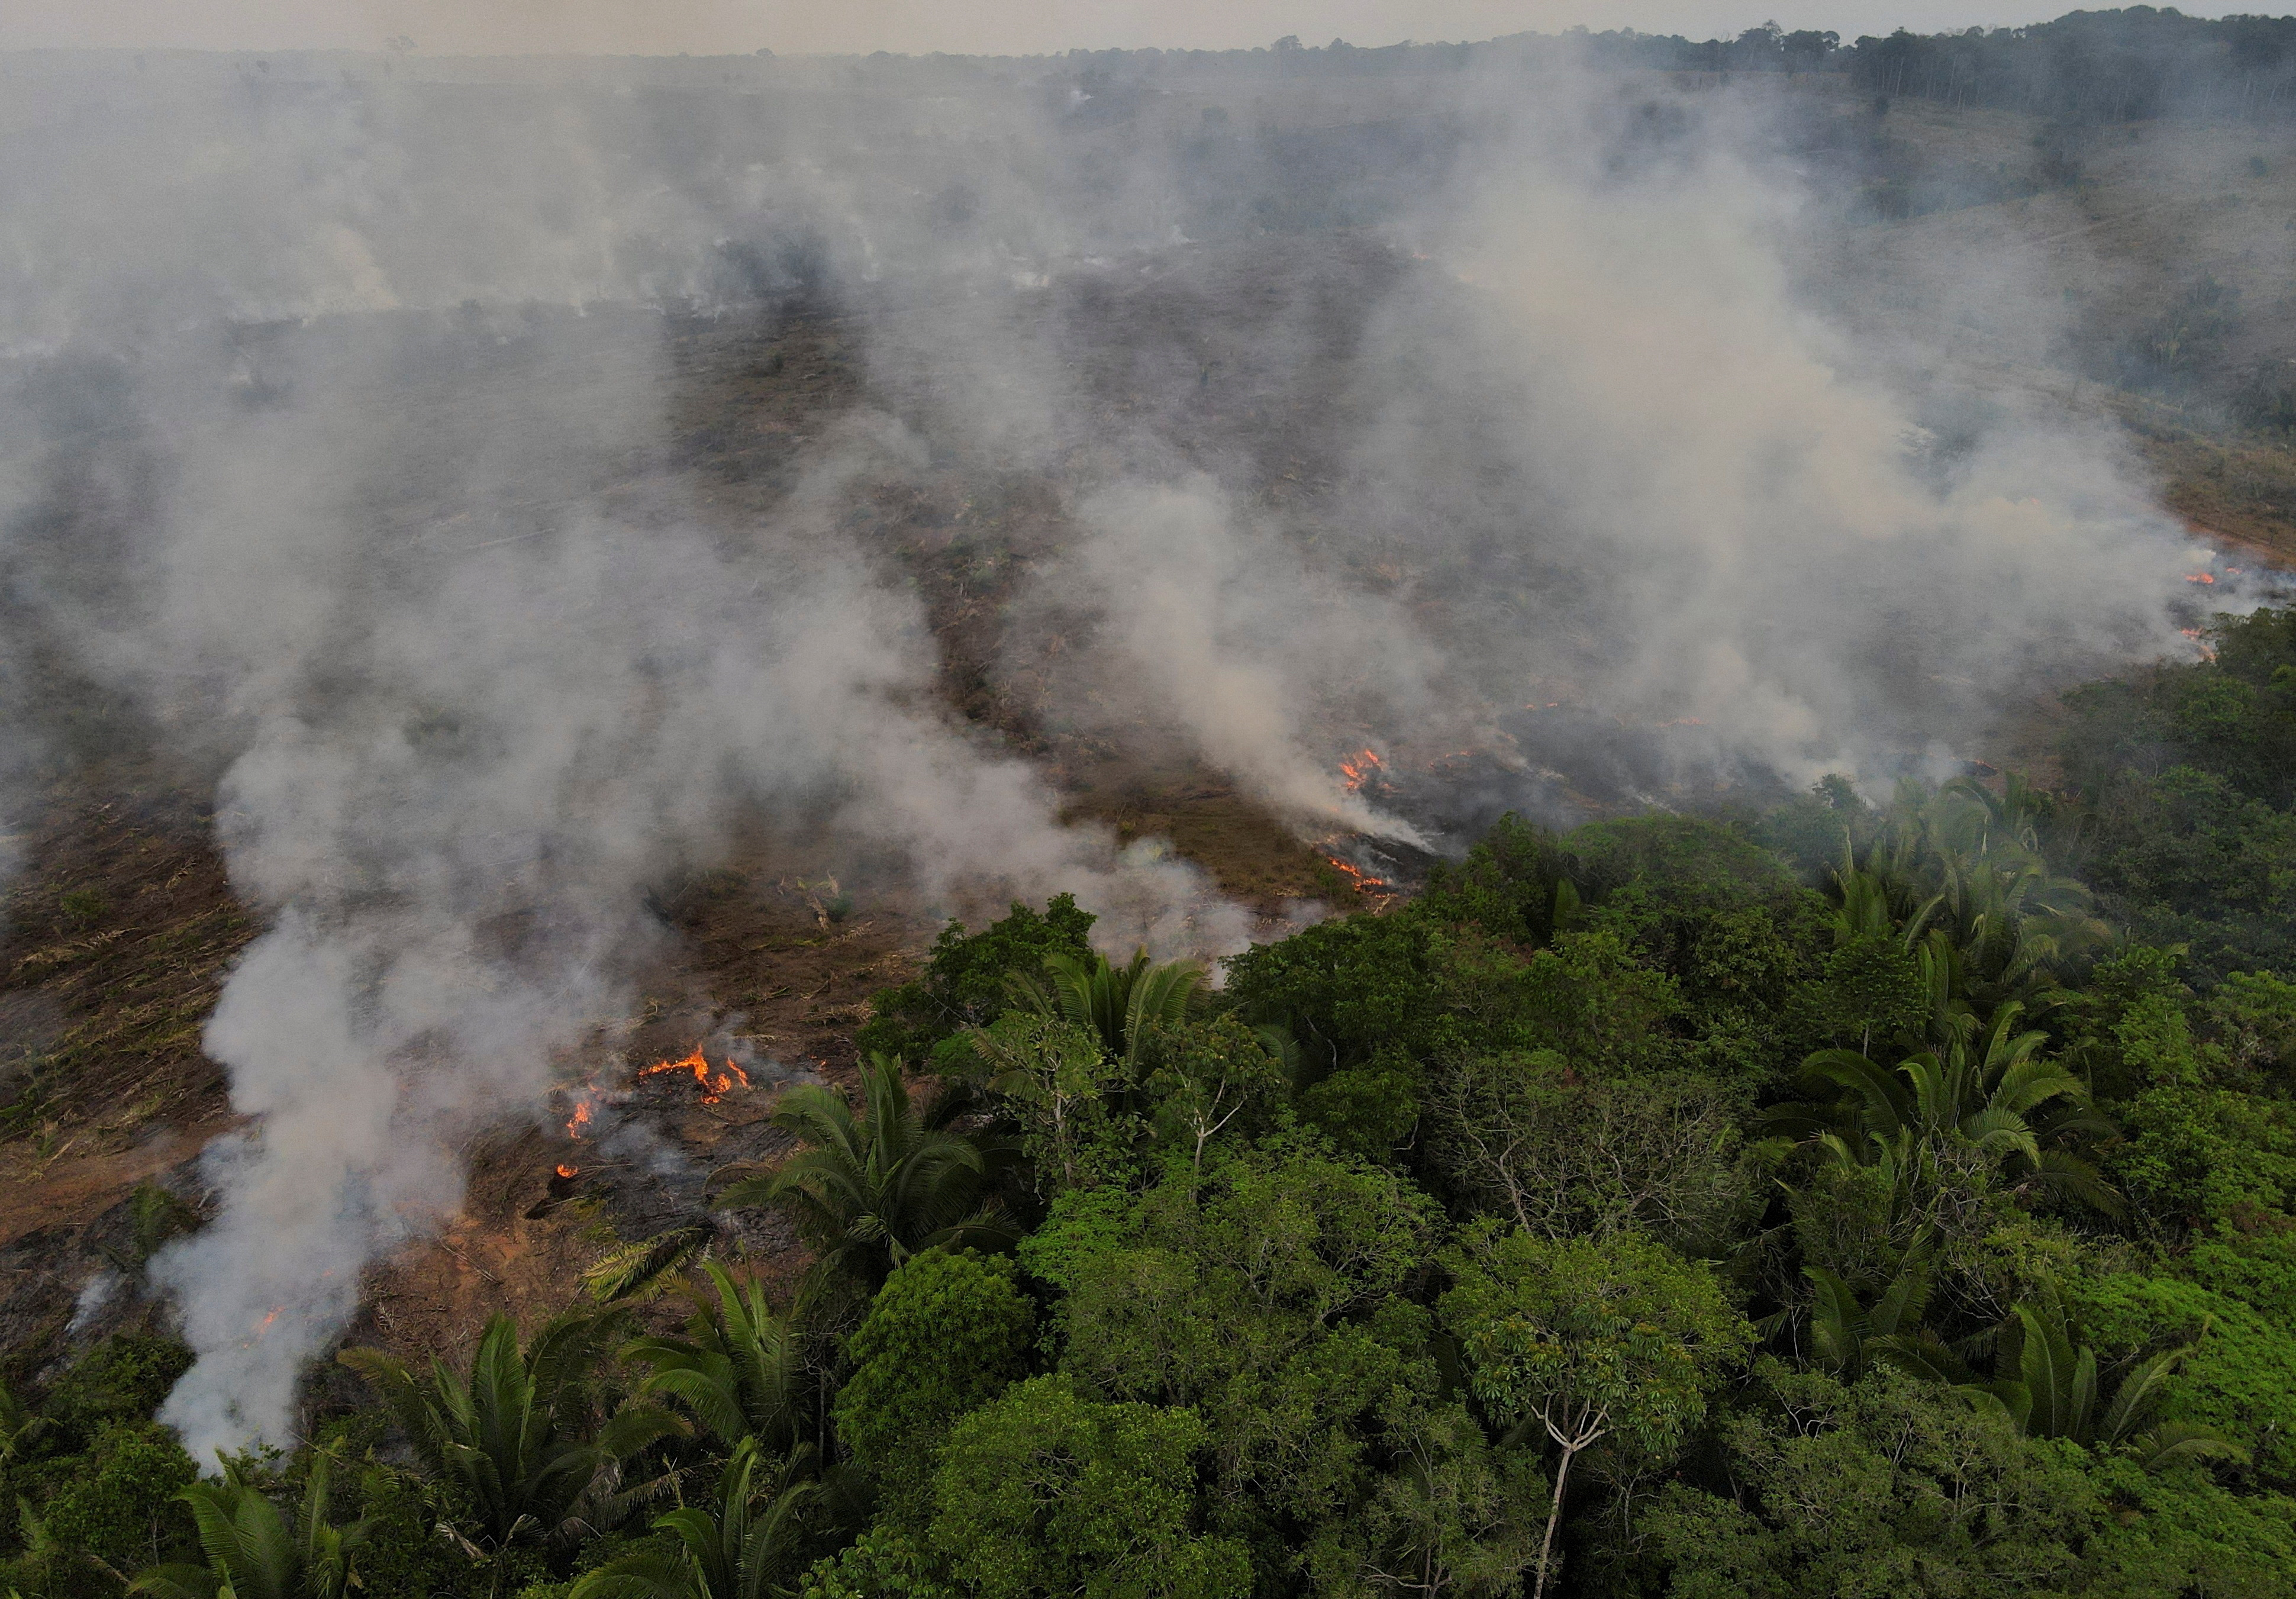
WILL THIS YEAR'S FIRE SEASON BE DIFFERENT?
Are the amazon fires contributing to climate change.
Sign up here.
Reporting by Jake Spring in Sao Paulo and Gloria Dickie in London; Editing by Katy Daigle
Our Standards: The Thomson Reuters Trust Principles. , opens new tab

Thomson Reuters
Jake Spring reports primarily on forests, climate diplomacy, carbon markets and climate science. Based in Brazil, his investigative reporting on destruction of the Amazon rainforest under ex-President Jair Bolsonaro won 2021 Best Reporting in Latin America from the Overseas Press Club of America (https://opcofamerica.org/Awardarchive/the-robert-spiers-benjamin-award-2021/). His beat reporting on Brazil’s environmental destruction won a Covering Climate Now award and was honored by the Society of Environmental Journalists. He joined Reuters in 2014 in China, where he previously worked as editor-in-chief of China Economic Review. He is fluent in Mandarin Chinese and Brazilian Portuguese.

Gloria Dickie reports on climate and environmental issues for Reuters. She is based in London. Her interests include biodiversity loss, Arctic science, the cryosphere, international climate diplomacy, climate change and public health, and human-wildlife conflict. She previously worked as a freelance environmental journalist for 7 years, writing for publications such as the New York Times, the Guardian, Scientific American, and Wired magazine. Dickie was a 2022 finalist for the Livingston Awards for Young Journalists in the international reporting category for her climate reporting from Svalbard. She is also an author at W.W. Norton.

US congressional committee subpoenas Blinken over Afghanistan
The U.S. House of Representatives Foreign Affairs Committee subpoenaed Secretary of State Antony Blinken on Tuesday, saying he had refused to appear before the panel to testify on the U.S. withdrawal from Afghanistan in August 2021.

- Environment

Everything you need to know about the fires in the Amazon
Why are the fires burning and why is it such a big deal.
By Justine Calma , a senior science reporter covering climate change, clean energy, and environmental justice with more than a decade of experience. She is also the host of Hell or High Water: When Disaster Hits Home, a podcast from Vox Media and Audible Originals.
Share this story
If you buy something from a Verge link, Vox Media may earn a commission. See our ethics statement.
:format(webp)/cdn.vox-cdn.com/uploads/chorus_asset/file/19125948/1164446768.jpg.jpg)
Record-breaking fires are ripping through the Amazon — an ecosystem on which the whole world depends. The Verge will update this page with news and analysis on the fires and the effects that could linger once the ash settles.
Table of Contents:
Why is the Amazon burning?
Why is this a big deal?
Why is this a hot topic politically?
- How are the fires being fought?
An unprecedented number of fires raged throughout Brazil in 2019, intensifying in August. That month, the country’s National Institute for Space Research (INPE) reported that there were more than 80,000 fires, the most that it had ever recorded. It was a nearly 80 percent jump compared to the number of fires the country experienced over the same time period in 2018. More than half of those fires took place in the Amazon.
The number of blazes decreased in September , after president Jair Bolsonaro bowed to mounting pressure to address the flames and announced a 60-day ban on setting fires to clear land. Some exceptions were made for indigenous peoples who practice subsistence agriculture and those who’ve received clearance by environmental authorities to use controlled burning to prevent larger fires.
“There is no doubt that this rise in fire activity is associated with a sharp rise in deforestation”
“These are intentional fires to clear the forest,” Cathelijne Stoof, coordinator of the Fire Center at Wageningen University (WUR) in the Netherlands, tells The Verge . “People want to get rid of the forest to make agricultural land, for people to eat meat.” The INPE found that deforestation in Brazil’s Amazon hit an 11-year high in 2019.
“There is no doubt that this rise in fire activity is associated with a sharp rise in deforestation,” Paulo Artaxo, an atmospheric physicist at the University of São Paulo, told Science Magazine . He explained that the fires are expanding along the borders of new agricultural development, which is what’s often seen in fires related to forest clearing.
President Jair Bolsonaro’s administration, which had pledged to open up the Amazon to more development, has sought to shift attention away from deforestation. Bolsonaro initially pointed a finger at NGOs opposing his policies for allegedly intentionally setting fires in protest, without giving any evidence to back his claim. In August, he fired the director of the National Institute for Space Research over a dispute over data it released showing the sharp uptick in deforestation that’s taken place since Bolsonaro took office. On August 20th, Brazil’s Minister of the Environment Ricardo Salles tweeted that dry weather, wind, and heat caused the fires to spread so widely. But even during the dry season, large fires aren’t a natural phenomenon in the Amazon’s tropical ecosystem.
:format(webp)/cdn.vox-cdn.com/uploads/chorus_asset/file/19126415/1163385128.jpg.jpg)
Everyone on the planet benefits from the health of the Amazon. As its trees take in carbon dioxide and release oxygen, the Amazon plays a huge role in pulling planet-warming greenhouse gases out of the atmosphere. Without it, climate change speeds up. But as the world’s largest rainforest is eaten away by logging, mining, and agribusiness, it may not be able to provide the same buffer.
“The Amazon was buying you some time that it is not going to buy anymore,” Carlos Quesada, a scientist at Brazil’s National Institute for Amazonian Research, told Public Radio International in 2018. Scientists warn that the rainforest could reach a tipping point , turning into something more like a savanna when it can no longer sustain itself as a rainforest. That would mean it’s not able to soak up nearly as much carbon as it does now. And if the Amazon as we know it dies, it wouldn’t go quietly. As the trees and plants perish, they would release billions of tons of carbon that has been stored for decades — making it nearly impossible to escape a climate catastrophe.
Everyone on the planet benefits from the health of the Amazon
Of course, those nearest to the fires will bear the most immediate effects. Smoke from the fires got so bad, it seemed to turn day into night in São Paulo on August 20th. Residents say the air quality is still making it difficult to breathe. On top of that, a massive global study on air pollution found that among the two dozen countries it observed, Brazil showed one of the sharpest increases in mortality rates whenever there’s more soot in the air.
And because fire isn’t a natural phenomenon in the region, it can have outsized impacts on local plants and animals. One in ten of all animal species on Earth call the Amazon home, and experts expect that they will be dramatically affected by the fires in the short term . In the Amazon, plants and animals are “exceptionally sensitive” to fire, Jos Barlow, a professor of conservation science at Lancaster University in the UK, said to The Verge in an email. According to Barlow, even low-intensity fires with flames just 30 centimeters tall can kill up to half of the trees burned in a tropical rainforest.
When Jair Bolsonaro was campaigning for office as a far-right candidate, he called for setting aside less land in the Amazon for indigenous tribes and preservation, and instead making it easier for industry to come into the rainforest. Since his election in October 2018, Bolsonaro put the Ministry of Agriculture in charge of the demarcation of indigenous territories instead of the Justice Ministry, essentially “letting the fox take over the chicken coop,” according to one lawmaker . His policies have been politically popular among industry and agricultural interests in Brazil, even as they’ve been condemned by Brazilian environmental groups and opposition lawmakers. Hundreds of indigenous women stormed the country’s capital on August 13th to protest Bolsonaro’s environmental rollbacks and encroachment of development on indigenous lands. The hashtag #PrayforAmazonia blew up on Twitter.
:format(webp)/cdn.vox-cdn.com/uploads/chorus_asset/file/19126393/1161492194.jpg.jpg)
About 60 percent of the Amazon can be found within Brazil’s borders, which gives the nation a massive amount of influence over the region. Not surprisingly, the fires have called international attention to the plight of the Amazon and have turned up the heat on Bolsonaro’s environmental policies.
French President Emmanuel Macron took to Twitter to call for action, pushing for emergency international talks on the Amazon at the G7 summit. On August 26th, the world’s seven largest economies offered Brazil more than $22 million in aid to help it get the fires under control. Bolsonaro promptly turned down the money, accusing Macron on Twitter of treating Brazil like a colony. Some in Brazil, including Bolsonaro, see the international aid as an attack on Brazil’s sovereignty , and its right to decide how to manage the land within its borders.
“Letting the fox take over the chicken coop”
President Donald Trump, on the other hand, congratulated Bolsonaro on his handling of the fires. “He is working very hard on the Amazon fires and in all respects doing a great job for the people of Brazil,” he tweeted on the 27th.
Bolsonaro has since said that he’ll reconsider the deal, as long as Macron takes back his “ insults ” and Brazil has control over how the money is spent. On the 27th, Bolsonaro accepted $12.2 million in aid from the UK.
:format(webp)/cdn.vox-cdn.com/uploads/chorus_asset/file/19126423/1164459408.jpg.jpg)
How are the fires being fought?
After weeks of international and internal pressure, Bolsonaro deployed the military to help battle the fires on August 24, sending 44,000 troops to six states. Reuters reported the next day that warplanes were dousing flames.
“It’s a complex operation. We have a lot of challenges,” Paulo Barroso tells The Verge. Barroso is the chairman of the national forest fire management committee of the National League of Military Firefighters Corps in Brazil. He has spent three decades fighting fires in Mato Grosso, one of the regions most affected by the ongoing fires. According to Barroso, more than 10,400 firefighters are spread thin across 5.5 million square kilometers in the Amazon and “hotspots” break out in the locations they’re unable to cover.
“We don’t have an adequate structure to prevent, to control, and to fight the forest fires”
Barroso contends that they need more equipment and infrastructure to adequately battle the flames. There are 778 municipalities throughout the Amazon, but according to Barroso, only 110 of those have fire departments. “We don’t have an adequate structure to prevent, to control, and to fight the forest fires,” Barroso says. He wants to establish a forest fire protection system in the Amazon that brings together government entities, indigenous peoples, local communities, the military, large companies, NGOs, and education and research centers. “We have to integrate everybody,” Barroso says, adding, “we need money to do this, we have to receive a great investment.”
Barroso and other experts agree that it’s important to look ahead to prevent fires like we’re seeing now. After all, August is just the beginning of Brazil’s largely manmade fire season, when slashing-and-burning in the country peaks and coincides with drier weather.
:format(webp)/cdn.vox-cdn.com/uploads/chorus_asset/file/19126433/1163748175.jpg.jpg)
Controlled burns are also a popular deforestation technique in other countries where the Amazon is burning, including Bolivia . There, the government brought in a modified Boeing 747 supertanker to douse the flames.
Using planes to put out wildfires in the Amazon isn’t a typical method of firefighting in tropical forests, and is likely to get expensive, Lancaster University’s Jos Barlow tells The Verge . He says that large-scale fires in areas cleared by deforestation “are best contained with wide firebreaks created with bulldozers — not easy in remote regions.” If the fires enter the forest itself, they require different tactics. “They can normally be contained by clearing narrow fire breaks in the leaf litter and fine fuel,” Barlow says. “But this is labour intensive over large scales, and fires need to be reached soon, before they get too big.”
Fires that have been intentionally set, as we’re seeing in Brazil, can be even more difficult to control compared to a sudden wildland fire. “They’re designed to be deliberately destructive,” says Timothy Ingalsbee, co-founder and executive director of Firefighters United for Safety, Ethics, and Ecology and research associate at the University of Oregon. Slashing before burning produces a lot of very dry, very flammable fuel. And at this scale, Ingalsbee calls the fires “an act of global vandalism.”
Barlow says, “The best fire fighting technique in the Amazon is to prevent them in the first place — by controlling deforestation and managing agricultural activities.”
WUR’s Cathelijne Stoof agrees: “Fighting the fires is of course important now,” she says. “For the longer term, it is way more important to focus on deforestation.”
Sony is taking Concord offline on September 6th after disastrous launch
Canva says its ai features are worth the 300 percent price increase, google pixel 9 review: the phone that android needs, the pixel 9 pro fold is the foldable we’ve been waiting for, the headphones that replaced my airpods.
More from Science
:format(webp)/cdn.vox-cdn.com/uploads/chorus_asset/file/23935561/acastro_STK103__04.jpg)
Amazon — like SpaceX — claims the labor board is unconstitutional
:format(webp)/cdn.vox-cdn.com/uploads/chorus_asset/file/25288452/246992_AI_at_Work_REAL_COST_ECarter.png)
How much electricity does AI consume?
:format(webp)/cdn.vox-cdn.com/uploads/chorus_asset/file/25287681/1371856480.jpg)
A Big Tech-backed campaign to plant trees might have taken a wrong turn
:format(webp)/cdn.vox-cdn.com/uploads/chorus_asset/file/25287408/2003731596.jpg)
SpaceX successfully launches Odysseus in bid to return US to the lunar surface
Case Study: The Amazon Rainforest
The amazon in context.
Tropical rainforests are often considered to be the “cradles of biodiversity.” Though they cover only about 6% of the Earth’s land surface, they are home to over 50% of global biodiversity. Rainforests also take in massive amounts of carbon dioxide and release oxygen through photosynthesis, which has also given them the nickname “lungs of the planet.” They also store very large amounts of carbon, and so cutting and burning their biomass contributes to global climate change. Many modern medicines are derived from rainforest plants, and several very important food crops originated in the rainforest, including bananas, mangos, chocolate, coffee, and sugar cane.

In order to qualify as a tropical rainforest, an area must receive over 250 centimeters of rainfall each year and have an average temperature above 24 degrees centigrade, as well as never experience frosts. The Amazon rainforest in South America is the largest in the world. The second largest is the Congo in central Africa, and other important rainforests can be found in Central America, the Caribbean, and Southeast Asia. Brazil contains about 40% of the world’s remaining tropical rainforest. Its rainforest covers an area of land about 2/3 the size of the continental United States.
There are countless reasons, both anthropocentric and ecocentric, to value rainforests. But they are one of the most threatened types of ecosystems in the world today. It’s somewhat difficult to estimate how quickly rainforests are being cut down, but estimates range from between 50,000 and 170,000 square kilometers per year. Even the most conservative estimates project that if we keep cutting down rainforests as we are today, within about 100 years there will be none left.
How does a rainforest work?
Rainforests are incredibly complex ecosystems, but understanding a few basics about their ecology will help us understand why clear-cutting and fragmentation are such destructive activities for rainforest biodiversity.

High biodiversity in tropical rainforests means that the interrelationships between organisms are very complex. A single tree may house more than 40 different ant species, each of which has a different ecological function and may alter the habitat in distinct and important ways. Ecologists debate about whether systems that have high biodiversity are stable and resilient, like a spider web composed of many strong individual strands, or fragile, like a house of cards. Both metaphors are likely appropriate in some cases. One thing we can be certain of is that it is very difficult in a rainforest system, as in most other ecosystems, to affect just one type of organism. Also, clear cutting one small area may damage hundreds or thousands of established species interactions that reach beyond the cleared area.
Pollination is a challenge for rainforest trees because there are so many different species, unlike forests in the temperate regions that are often dominated by less than a dozen tree species. One solution is for individual trees to grow close together, making pollination simpler, but this can make that species vulnerable to extinction if the one area where it lives is clear cut. Another strategy is to develop a mutualistic relationship with a long-distance pollinator, like a specific bee or hummingbird species. These pollinators develop mental maps of where each tree of a particular species is located and then travel between them on a sort of “trap-line” that allows trees to pollinate each other. One problem is that if a forest is fragmented then these trap-line connections can be disrupted, and so trees can fail to be pollinated and reproduce even if they haven’t been cut.
The quality of rainforest soils is perhaps the most surprising aspect of their ecology. We might expect a lush rainforest to grow from incredibly rich, fertile soils, but actually, the opposite is true. While some rainforest soils that are derived from volcanic ash or from river deposits can be quite fertile, generally rainforest soils are very poor in nutrients and organic matter. Rainforests hold most of their nutrients in their live vegetation, not in the soil. Their soils do not maintain nutrients very well either, which means that existing nutrients quickly “leech” out, being carried away by water as it percolates through the soil. Also, soils in rainforests tend to be acidic, which means that it’s difficult for plants to access even the few existing nutrients. The section on slash and burn agriculture in the previous module describes some of the challenges that farmers face when they attempt to grow crops on tropical rainforest soils, but perhaps the most important lesson is that once a rainforest is cut down and cleared away, very little fertility is left to help a forest regrow.
What is driving deforestation in the Amazon?
Many factors contribute to tropical deforestation, but consider this typical set of circumstances and processes that result in rapid and unsustainable rates of deforestation. This story fits well with the historical experience of Brazil and other countries with territory in the Amazon Basin.
Population growth and poverty encourage poor farmers to clear new areas of rainforest, and their efforts are further exacerbated by government policies that permit landless peasants to establish legal title to land that they have cleared.
At the same time, international lending institutions like the World Bank provide money to the national government for large-scale projects like mining, construction of dams, new roads, and other infrastructure that directly reduces the forest or makes it easier for farmers to access new areas to clear.
The activities most often encouraging new road development are timber harvesting and mining. Loggers cut out the best timber for domestic use or export, and in the process knock over many other less valuable trees. Those trees are eventually cleared and used for wood pulp, or burned, and the area is converted into cattle pastures. After a few years, the vegetation is sufficiently degraded to make it not profitable to raise cattle, and the land is sold to poor farmers seeking out a subsistence living.
Regardless of how poor farmers get their land, they often are only able to gain a few years of decent crop yields before the poor quality of the soil overwhelms their efforts, and then they are forced to move on to another plot of land. Small-scale farmers also hunt for meat in the remaining fragmented forest areas, which reduces the biodiversity in those areas as well.
Another important factor not mentioned in the scenario above is the clearing of rainforest for industrial agriculture plantations of bananas, pineapples, and sugar cane. These crops are primarily grown for export, and so an additional driver to consider is consumer demand for these crops in countries like the United States.
These cycles of land use, which are driven by poverty and population growth as well as government policies, have led to the rapid loss of tropical rainforests. What is lost in many cases is not simply biodiversity, but also valuable renewable resources that could sustain many generations of humans to come. Efforts to protect rainforests and other areas of high biodiversity is the topic of the next section.
- Share full article
Advertisement
Subscriber-only Newsletter
Climate Forward
A heat pump can cut your emissions. but read this before you switch..
A Times climate reporter recounts his journey to switch his home’s HVAC system to a climate-friendly heat pump.

By Christopher Flavelle
Reporting from my furnace room.
You’ve probably heard the pitch for heat pumps: They can cut greenhouse gas emissions by more than half compared with traditional gas-powered HVAC systems. They’ll save you money because you’ll pay less for energy. And, thanks to the tax credits passed by Congress in 2022, they’re more affordable than ever. What’s not to love?
Based on my experience switching to a heat pump this summer, that pitch may gloss over some important points.
One muggy Monday morning in July, I noticed the vents in my house in Washington, D.C., had ceased their usual reassuring, cooling whoosh. An urgently summoned repairman delivered grim news: My HVAC system was shot and would cost thousands of dollars to fix — if it was fixable at all, given its ancientness. Better, he advised, to replace the air-conditioner and furnace altogether. A second opinion, then a third, yielded the same verdict.
I tried to stay positive: Maybe this was my chance to get a heat pump. As one expert put it to Wirecutter, the product review site owned by The New York Times, this month , the devices are so efficient that they’re “like magic.”
The call to reduce household emissions resonated especially strongly for me. My wife and I live in an old house, and our appliances include a gas-powered stove, a gas-powered water heater, a gas-powered barbecue and even a gas-powered clothes dryer. I increasingly felt like I was on the wrong side of history.
What’s more, I have a very specific job at the Times: I write about the challenges of adapting to a warming world. I can’t pretend to be blind to the ramifications of unabated emissions, of lifestyle changes not taken.
We are having trouble retrieving the article content.
Please enable JavaScript in your browser settings.
Thank you for your patience while we verify access. If you are in Reader mode please exit and log into your Times account, or subscribe for all of The Times.
Thank you for your patience while we verify access.
Already a subscriber? Log in .
Want all of The Times? Subscribe .
Thank you for visiting nature.com. You are using a browser version with limited support for CSS. To obtain the best experience, we recommend you use a more up to date browser (or turn off compatibility mode in Internet Explorer). In the meantime, to ensure continued support, we are displaying the site without styles and JavaScript.
- View all journals
- Explore content
- About the journal
- Publish with us
- Sign up for alerts
- Open access
- Published: 02 September 2024
Upwind moisture supply increases risk to water security
- José Posada-Marín ORCID: orcid.org/0000-0001-7456-8772 1 , 2 , 3 ,
- Juan Salazar ORCID: orcid.org/0000-0001-7963-7466 1 ,
- Maria Cristina Rulli ORCID: orcid.org/0000-0002-9694-4262 4 ,
- Lan Wang-Erlandsson ORCID: orcid.org/0000-0002-7739-5069 5 , 6 , 7 &
- Fernando Jaramillo ORCID: orcid.org/0000-0002-6769-0136 2
Nature Water ( 2024 ) Cite this article
80 Altmetric
Metrics details
- Environmental sciences
Transboundary assessments of water security typically adopt an ‘upstream’ perspective, focusing on hazards and vulnerabilities occurring within a given hydrological basin. However, as the moisture that provides precipitation in the hydrological basin probably originates ‘upwind’, hazards and vulnerabilities potentially altering the moisture supply can be overlooked. Here we perform a global assessment of risk to water security in 379 hydrological basins accounting for upwind vulnerabilities and hazards from limited governance and environmental performance. We compare this upwind assessment with the more conventional approach focusing upstream. We find that accounting for upwind moisture supply increases the assessed risk to water security. The upwind perspective results in 32,900 km 3 yr −1 of water requirements (that is, the specific water needs of vegetation for their development) under very high risk, compared with 20,500 km 3 yr −1 under the upstream perspective. This study pinpoints the need to account for upwind moisture dependencies in global water-related risk assessments.
Diagnosing challenges and setting priorities for sustainable water resource management under climate change
Evaluating the economic impact of water scarcity in a changing world
Importance and vulnerability of the world’s water towers
Globally, around 40% of continental precipitation originates in evaporation from land 1 . This amount increases to 80–90% in some regions in Eurasia, South America and Africa 2 . Hence, precipitation over large parts of the Earth’s land surface can be vulnerable to upwind changes in the amount and timing of evaporation entering the atmosphere 3 , 4 , 5 . Land and water use related to human activities for food and energy production are known to alter such evaporation 6 , 7 , 8 , 9 , 10 . For instance, irrigation has been found to increase precipitation downwind, while deforestation decreases it 11 , 12 , 13 , 14 , 15 , 16 , 17 , 18 . Upwind loss in evaporation can result in loss in downwind precipitation with impacts on agricultural 12 , 19 , 20 , 21 , 22 and hydropower 23 , water availability in surface and groundwater resources 19 , aquatic and terrestrial ecosystems 24 , 25 , 26 and the livelihoods of many urban and rural communities 27 .
These implications have led to calls to include atmospheric water flows in transboundary water management and decision-making 28 , 29 . Other calls insist on their inclusion in international law 30 and broader water governance frameworks 28 , 31 , 32 , 33 . For instance, political instability can weaken the control of illegal practices fuelling environmental degradation, such as illicit agricultural expansion and mining 34 . The lack of land and water governance and a weak environmental performance can lead to deforestation 35 and the disappearance of ecosystems that are key for atmospheric moisture supply. As another example, a lack of voice and accountability implies a disregard for citizens in the control or curve of environmental degradation that may lead to modifications of vapour flows 36 .
Risk to water security—that is, the human capacity to ensure reliable access to safe and sufficient water resources—is typically calculated as the product of the hazard (natural or human-induced events causing harm), vulnerability (physical susceptibility to adverse effects) and exposure (elements at risk of being affected) 37 . Risk estimates usually account for upstream hazards in the hydrological basin 38 , 39 , 40 . The risks relate to downstream implications of decreasing water supply in rivers 41 , mountain glaciers 42 , lakes 43 , wetlands 44 , aquifers 45 , 46 and even soil moisture 40 . Yet, recent studies have also included the vulnerabilities and exposures arising from upwind dependencies for water security 27 , 32 . For instance, Keys et al. 27 merged upstream and upwind dependencies to estimate the integrated water supply vulnerability for 29 megacities. The growing interest in accounting for upwind dependencies for risk assessment matters as precipitation over a hydrologic basin depends on terrestrial moisture recycling (TMR), the mechanism by which upwind evaporation feeds downwind precipitation either within a hydrological basin (local moisture recycling) or across different basins. The dependency can increase or decrease the risk of natural vegetation and crops not receiving the required supply of freshwater 47 , 48 , 49 , 50 .
Here we build on previous studies that consider the upwind vulnerability of freshwater supply 27 , 32 , 33 to analyse global risks to water security. Our main aim is to quantify how accounting for upwind dependencies arising from governance and environmental performance affects the risk in 379 worldwide basins. We estimate risk from two perspectives; the first, ‘upstream’, is based on political, geographical, ecosystemic and hydroclimatic conditions in the countries sharing the hydrological basin. The second perspective, named ‘upwind’, relates to the countries sharing the hydrological basin’s precipitationshed 20 , the upwind continental regions contributing moisture. We consider the freshwater requirements of vegetation and crops within the basin as the most representative exposed asset for basin-scale water security.
We identified 379 large hydrological basins (greater than 3,400 km 2 ) covering 85 Mkm 2 whose precipitationsheds extend across more than one country. We refer to these basins as upwind transboundary basins in contrast to the typical definition of upstream transboundary (that is, the hydrological basin is shared by several countries). Around one-third of these upwind transboundary basins (153) are also upstream transboundary. From these upwind transboundary basins, the ones with the highest TMR and, thus, high upwind continental moisture dependency include the Tarim, Huang He, Amur, Yenisei and Lena River basins (Fig. 1 ). The TMR ratio can indicate how susceptible the water availability of a given hydrological basin is to changes in upwind moisture supply. For instance, a basin depending solely on moisture transport from the ocean would not be affected by any change in land use as long as atmospheric moisture convergence is not affected. Conversely, a basin depending only on continental moisture is subject to any potential change in moisture supply resulting from land use changes.
The relationship between governance ( y axis), environmental performance ( x axis), TMR ratios (colour gradient) and the area of the basin (size of the circle). Governance is calculated as the mean of the five governance indicators (voice accountability, political stability, government effectiveness, regulatory quality and the rule of law; Supplementary Fig. 2a ) reported by the World Bank 87 and area-weighted on the basis of the countries lying within the precipitationshed of each hydrological basin. Similarly, environmental performance is given by the 40 indicators of the Environmental Performance Index (Supplementary Fig. 2b ) from the Yale Center for Environmental Law and Policy 88 . The dashed red polygon highlights basins with low levels of upwind governance and environmental performance.
Source data
Most large basins typically have high TMR and low governance values (that is, less than 0.6). Interestingly, the hydrological basins with the highest TMR range between 0 and 0.6 of the maximum governance that can be obtained, pointing to low governability. The Congo River Basin is an example of a large basin with low governance and environmental performance. The water requirements of the Congo River Basin (Supplementary Fig. 1 ) have a high dependency on land cover changes occurring upwind; its TMR ratio reaches ~73%, and most of the moisture precipitating in the basin has a terrestrial origin, covering countries such as South Sudan, Central African Republic, Congo, Angola and the Democratic Republic of the Congo. Concern about the moisture dependency of the Congo River Basin arises as the low governance and environmental performance of the countries in its precipitationshed (Supplementary Fig. 2 ) may imply potential hazards to water security. Risks may arise from, for instance, threats of deforestation within the precipitationshed, which can potentially reduce upwind moisture flows, or uncontrolled irrigation, which may increase them 4 .
The first component of risk is the hazard. The potential hazard resulting after combining aspects of governance and environmental performance ( Methods and Supplementary Fig. 2 ) depends on whether these aspects are analysed for the upwind (within the precipitationshed) or upstream (within the hydrological basin) countries (Fig. 2a,b ). We can identify from both perspectives the highest hazard values in Africa, the Middle East and Asia from the combination of very low to middle values of governance and environmental performance (Fig. 2c,d and Supplementary Fig. 2 ). In African and Middle Eastern countries, the hazard is mainly related to low governance values (Supplementary Fig. 2a ), while in Asian countries, it is due to low environmental performance (Supplementary Fig. 2b ). We find that the mean global difference between assessing hazard from an upwind and upstream perspective is not statistically significant at the global scale ( P > 0.05, Wilcoxon rank-sum test; Fig. 2b ); a similar number of basins increase or decrease their hazard. Several hydrological basins in Asia (for example, the Yangtze, Ganges and Krishna River basins) and Africa (for example, the Volta, Ogooue and Zambezi River basins) tend to increase their hazards the most when applying an upwind perspective (Fig. 2a ). In contrast, some eastern Europe basins experience the most decrease (for example, the Volga, Dniepr and Neva River basins).
a , The difference between the hazard estimates of the upwind and upstream perspectives (upwind minus upstream). b , A comparison of the distribution of hazards (box plots) of the 379 upwind transboundary basins when including countries in their hydrological basins (upstream) and their precipitationsheds (upwind). In the upstream (upwind) perspective, the minimum value recorded is 0.0 (0.0) and the maximum value is 1.0 (1.0). The centre of the box plot, representing the median of the data, is 0.31 (0.31). The bounds of the box are defined by the first quartile (Q1) and the third quartile (Q3), which are 0.03 (0.06) and 0.47 (0.58), respectively. The whiskers extend to the minimum and maximum values of the distributions. The samples were compared with a one-sided unpaired Wilcoxon rank-sum test to determine the statistical significance of the difference between both perspectives ( P value 0.25; Wilcoxon rank-sum test). c , d , The five categories (very high, high, middle, low and very low) are based on min–max normalized values of the hazard after separation in quantiles for the upstream ( c ) and upwind ( d ) perspectives.
The second risk component is the exposure of the asset at risk, that is, the total water requirements for vegetation and crops within the hydrological basin. The Amazon and Congo basins also have some of the largest total water exposure to hazards due to the large freshwater requirements of vegetation within them (Supplementary Fig. 1a ). Hence, a higher water requirements implies a larger exposure to upwind/upstream moisture supply changes. These requirements comprise both green water (GW)—the precipitation on land temporarily stored in soil and consumed by vegetation (Supplementary Fig. 1b )—and blue water (BW)—freshwater in lakes, rivers and aquifers, mainly consumed in irrigated agriculture (Supplementary Fig. 1c ). The total GW and BW requirements in the upwind transboundary basins reaches 40,600 km 3 yr −1 globally.
The third risk component, vulnerability (Fig. 3 and Supplementary Figs. 3 and 4 ), is the natural susceptibility to adverse effects. Vulnerability results are higher when considering the areas and countries within the precipitationshed than those within the hydrological basin. Contrary to the hazard, the vulnerability shows statistically significant differences between the upwind and upstream perspectives at the global scale (Wilcoxon rank-sum test, P < 0.05; Fig. 3a,b ). Around 88% of the upwind transboundary basins increase their vulnerability when shifting from an upstream to an upwind perspective of risk (Fig. 3a ). The most marked differences occur in Europe (for example, the Danube, Volga, Dniepr and Po River basins), Asia (for example, the Tarim, Ganges, Indus and Narmada River basins) and Africa (for example, the Niger, Senegal, Ogooue and Volta River basins).
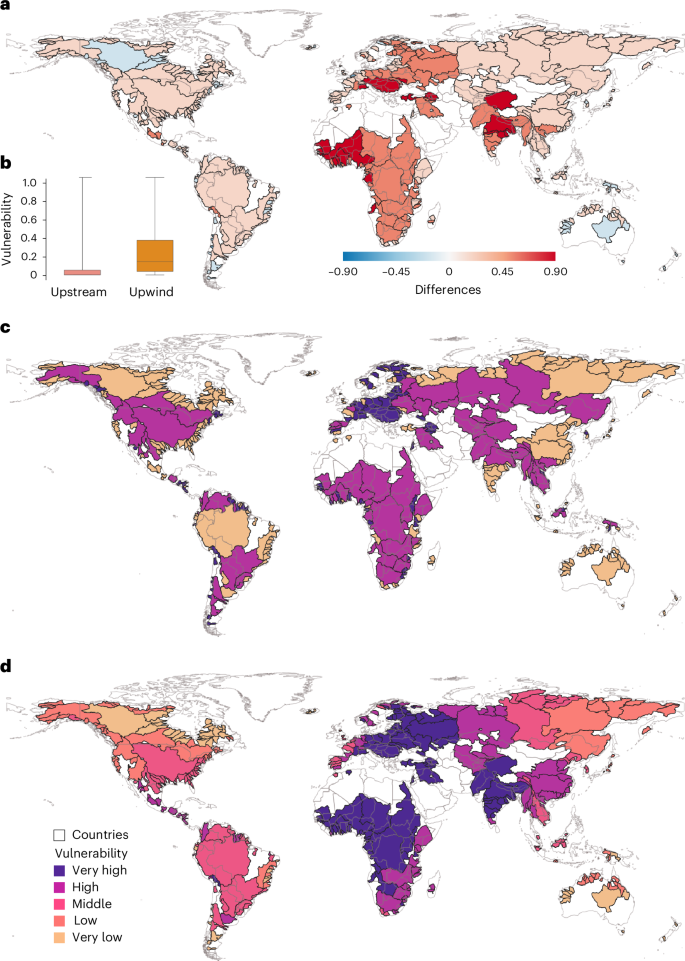
a , Geophysical vulnerability differences between perspectives (upwind minus upstream). b , The vulnerability distribution (box plots) for the 379 hydrological basins with transboundary precipitationsheds by perspective. In the upstream (upwind) perspective, the minimum value recorded is 0.0 (0.0) and the maximum value is 1.0 (1.0). The centre of the box plot, representing the median of the data, is 0.00 (0.14). The bounds of the box are defined by the first quartile (Q1) and the third quartile (Q3), which are 0.00 (0.04) and 0.05 (0.36), respectively. The whiskers extend to the minimum and maximum values of the distributions. The samples were compared with a one-sided unpaired Wilcoxon rank-sum test to determine statistical significance in differences ( P value 3.88 × 10 −55 ). c , d , Once normalized using a min–max normalization, these values are divided into five categories: very high, high, middle, low and very low, using the quantiles of their distribution for both upstream ( c ) and upwind ( d ) perspectives.
The mean global increase in vulnerability results from a mean global increase in interdependency ( P < 0.05, Wilcox rank-sum test; Supplementary Fig. 5d ) that is more influential to the score of vulnerability than the global mean decrease in fragility ( P < 0.05, Wilcox rank-sum test; Supplementary Fig. 5b ). Interdependency refers to the number of countries within the basin or precipitationshed, depending on the perspective, assuming that it will be easier to establish management measures and cooperation in water policy if the number of countries is low. Likewise, fragility relates to the area of the hydrological basin or precipitationshed, assuming that the capacity to meet the freshwater requirements at the scale of the hydrological basin is more fragile in smaller surface areas. Furthermore, it is worth noting that most of the basins experiencing higher vulnerabilities from an upwind perspective have relatively large TMR ratios, highlighting their dependency on continental moisture flows originating upwind. Changes in the magnitude of vulnerability between perspectives lead to a reassessment of the vulnerability categories (Fig. 3c,d ). For instance, the Amazon, Danube, Congo, Nile, Ganges and Yangtze increase their vulnerability from lower to higher levels when the upwind dependency is accounted for. Overall, the hydrological basins in Africa, the Middle East, Eastern Europe and the Indian Peninsula increase their vulnerability to very high levels.
Comparison of risk assessment frameworks
We classified the exposure in the hydrological basins (Supplementary Fig. 1a ) based on the resulting risk category for both perspectives (Fig. 4 ). We find that, while in the upstream perspective ~70% of total water requirements are under middle to very high risk, in the upwind perspective the number increases to 90% (Fig. 4a ). As such, low upwind governance and environmental performance result in 32,900 km 3 yr −1 of total water requirements (75%; purple bar) under very high risk, while an upstream lack of these aspects results in much smaller freshwater requirements under very high risk (20,500 km 3 yr −1 ; 47%). This is related to the increase in the risk category of larger basins with high freshwater requirements at the expense of reductions in the categories of smaller basins with much lower water requirements. The considerably higher upwind risk is also evidenced across both GW (Fig. 4b ) and BW (Fig. 4c ) requirements, but most notably for the latter. These results indicate an important underestimation of transboundary water security risk emerging from upwind vulnerabilities and hazards and challenge the common practice of assessing the risk to BW requirements from changes in land and water use occurring just within the hydrological basin.
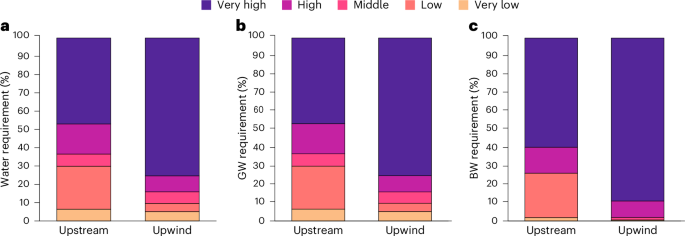
a – c , The relative amount of total water ( a ), GW ( b ) and BW ( c ) requirements for each perspective and in each of the five risk categories in all hydrological basins. For example, 89% of BW requirements are at a very high risk when upwind conditions are considered.
Reassessment of global risk to water security
Notably, the upwind risk is very high in the majority of world’s largest basins (Fig. 5c ) owing to the large volumes of water requirements (exposure), which largely depend on the basin area ( R = 0.89; Supplementary Table 1 ). Most of these large basins also exhibit high TMR dependency (Supplementary Fig. 4d ) and low values of governance and environmental performance (Fig. 1 and Supplementary Fig. 6 ). From an upwind perspective, the Congo, Nile and Niger River basins have the largest risk to water security worldwide (Supplementary Table 2 ). Interestingly, these basins also have the highest risk from an upstream perspective (Supplementary Table 2 ). Notably, the consistent high risk among both perspectives for the Congo results from the combination of (1) high dependency on terrestrial moisture from the African continent, (2) the low governance and environmental performance of the countries located in its precipitationshed and hydrological basin, (3) the high GW requirements of its tropical vegetation and (4) its large areal extent. The Volta, Zambezi and Indus River basins are also ranked in the first ten positions of risk in both perspectives.
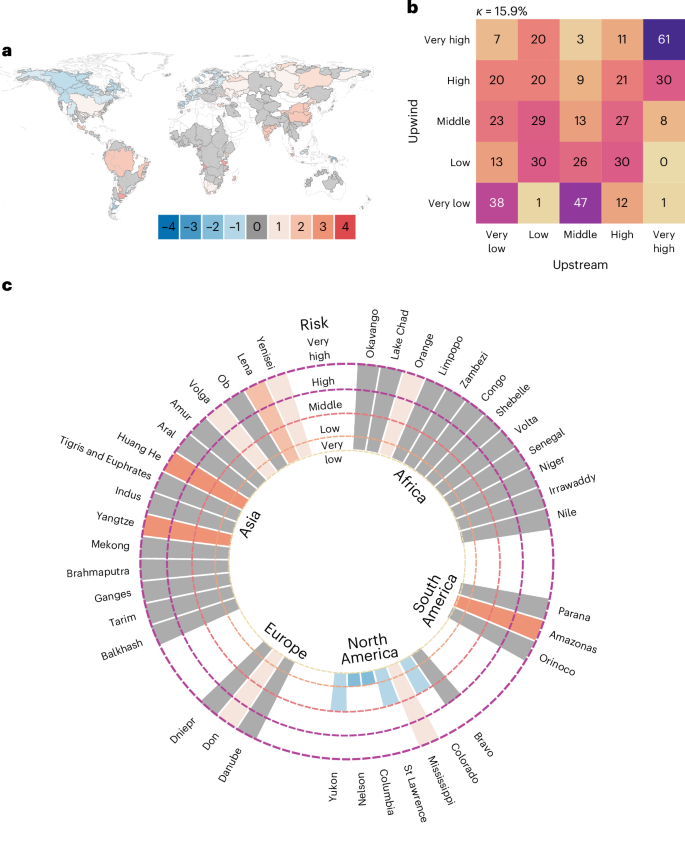
a , Changes in risk categorization between perspectives; positive (negative) values indicate higher (lower) risk in the upwind perspective. b , The heat map shows the percentage agreement matrix, with the intersection between rows and columns indicating the percentage agreement of classified basins in each upwind (rows) and upstream (columns) risk category. For instance, about 11% of basins present a very high risk from an upwind perspective and a high risk from the upstream perspective. c , Changes in risk categorization to the 40 worldwide largest basins. The bar height indicates the risk category in the upwind perspective (see concentric circles), and its colour shows if it increases, decreases or has no changes and how many risk categories each basin changes from the upstream perspective (see colour bar in a ).
The differences in terms of risk from both perspectives result in a change in the ranking of hydrological basins (Figs. 5a and 6 ). More than half of the hydrological basins categorized with very high risk under the upstream perspective hold their risk category from an upwind perspective (Fig. 5b , 61%, top right), whereas only 38% of those in the very low risk hold their risk category (Fig. 5b , bottom left). Some of the basins with considerable changes in their risk ranking include the Amazon, Salado, Rufiji, Krishna, Yangtze and Huang He River basins, where risk increases from low (upstream) to very high (upwind) (Fig. 5a ). The Amazon and Yangtze River basins, some of the largest basins on Earth, are included in the first ten risk positions from the upwind perspective, and their vulnerability increases when the TMR dependency is accounted for. For the case of the Yangtze, its precipitationshed extends over several South Asian countries with reported low governance and environmental performance (for example, India, Myanmar and Vietnam; Supplementary Fig. 2 ). Furthermore, it ranks high in terms of exposure (water requirements of 1,000 km 3 yr −2 ) and vulnerability (that is, many countries sharing it and ~78% of TMR).
Unexpected transboundary water-related risks can emerge from the interaction of upwind vulnerabilities and hazards related to governance and environmental performance. The hazards can lead to progressive land and water use changes, potentially altering the moisture supply to downwind hydrological basins 29 , 31 , 32 , 51 , 52 . Biogeophysical properties related to vegetation on land, such as those expressed by surface albedo, surface roughness length, rooting depth, leaf stomatal conductance and leaf/stem area index, control evaporation over a given surface. Land use changes that alter vegetation can thus drive evaporation changes, with the change magnitude and direction depending on both the original vegetation cover and that resulting after the change in land use 53 , 54 , 55 , 56 . For instance, the conversion of forests to grasslands mostly reduces evaporation 54 , 56 , 57 , 58 , 59 , 60 , 61 . Forest clear-cutting has been found to reduce evaporation and increase runoff; reforestation or regrowth has resulted in the opposite effect 53 , 55 . These changes may translate into changes in the amount of moisture advected and precipitating in downwind hydrological basins 22 , 23 . Hence, the degree to which this occurs depends on the type and extent of the evaporation changes and moisture convergence.
While studies 4 , 5 , 7 , 20 , 26 , 50 , 62 , 63 already point to the corresponding heterogeneous effects of land and water use changes on moisture supply downwind, this study rather focuses on the factors of governance and environmental performance that can impede, slow, drive or foster these changes and the corresponding risks to downwind water security. As tensions related to transboundary water governance can emerge when hydrological basins are shared by different countries or regulating authorities 64 , 65 , 66 , 67 , 68 , 69 , 70 , tension among countries from sharing a specific precipitationshed could emerge as well. These tensions could increase when various countries are involved, requiring additional agreement and cooperation 68 , 69 , 70 . For instance, several basins in South America (for example, the Magdalena, Orinoco and Parana River basins) depend on moisture recycling from the Amazon Basin 7 ; their precipitationsheds extend over this basin. The Amazon Basin is shared by several countries that have tried to establish agreements to reduce deforestation but with difficult progress due to each country’s internal policies 34 , 71 . Several studies have shown the potential impacts of Amazon deforestation on precipitation and water availability in South America 7 , 11 , 18 , 23 , 50 . Accounting for upwind dependencies could then increase the interest in moisture upwind dependencies in the region, potentially leading to tensions between countries (understood not only as disputes between countries but also as any problem threatening regional water security) and cooperation to avoid or solve these tensions 72 . Similar issues could occur in other regions with a comparable context (for example, the Congo hydrological basin 73 , 74 , 75 ).
Transboundary cooperation can play a crucial role in mitigating these tensions 64 , 68 , 69 , 70 . Cooperative management and agreements on shared water resources can significantly reduce tension and promote sustainable usage 28 , 66 , 68 , 69 , 70 . Collaborative efforts in managing surface water availability, atmospheric moisture recycling and land use changes in upwind areas are relevant for maintaining water security and preventing disputes, particularly in water-scarce regions 28 , 47 , 75 , 76 . This study can help detect where and to whom cooperation strategies and efforts can be addressed to mitigate the causes of water-related tensions. Nevertheless, further research is necessary to explore the mechanisms through which cooperation can be enhanced to address these challenges effectively, particularly in the face of increased demand for water resources due to climate change and the growing globalized economy 66 .
Upwind risks are commonly overlooked in the assessment of transboundary water security. Moreover, not considering these risks may disregard the transboundary nature of numerous worldwide basins. The identified differences in this study, comparing a traditional upstream framework with an innovative upwind approach, reveal an underestimation of the risk to global water requirements. This emphasizes reassessing upwind transboundary basins according to their water risk levels. Such emerging results have and could lead to surprises in similar assessments for urban and energy-related water security 27 , 77 , 78 . We recommend that transboundary water security assessments add the upwind moisture dependency to the more common factors that threaten or affect water availability (for example, anthropogenic inter-basin water transfer and groundwater regional fluxes).
The co-dependence between upstream/downwind and downstream/upwind countries cannot be disregarded. For instance, again, in the case of tropical South America, large areas of the Andes are downwind of the Amazon forest, whereas most of the Amazon Basin is downstream of the Andes. Understanding this co-dependence could improve the hydro-cooperation between nations owing to the transnational mutual interests concerning water security and, hopefully, a more united approach to guarantee global long-term water security. This understanding depends on the confidence in tracking moisture simulations. Further research should be addressed to reduce uncertainty in these simulations through validation and intercomparison projects. Our findings, rather than a clear demonstration that the upwind moisture flux is threatened, is an alert showing worldwide basins where upwind risk could emerge with important implications to water security.
We invite a reflection on the common paradigm of managing and governing water beyond the hydrological basin and the required shift in assessing water-related risk and governance. The shift comprises a change from the view that uses only the concepts of hydrological basin or watershed—which have long been regarded as the best units and scales to govern and understand risks related to water changes 51 , 79 —to a more comprehensive view that includes atmospheric water 32 . The potential management of water beyond hydrological basin boundaries poses challenges regarding geopolitics, governance and the understanding of moisture transport. Addressing these challenges should lead to (1) the creation of new organizations or frameworks that in the future may be capable of managing water upwind or at least (2) an institutional fit of current river basin organizations to tackle the new dependencies emerging from a better understanding of moisture transport and implications for water security 80 . Assessing upwind water-related risks should improve the transboundary water agenda and help establish atmospheric governance on the water as a common good 30 , 31 .
Risk assessment frameworks
We adopted the concept of risk proposed in the Intergovernmental Panel on Climate Change Sixth Assessment Report 81 . Risk is defined as the potential consequences over a valuable subject resulting from the interaction of hazard, vulnerability and exposure. Hazard is the occurrence of natural accidents or human-induced events causing harm that may adversely affect vulnerable elements, causing loss of life, injury, damage and loss to property, infrastructure, livelihoods, service provision, ecosystems and environmental resources 81 . Vulnerability is the susceptibility, propensity or predisposition to be adversely affected. Vulnerability calculations encompass a variety of concepts and elements, including sensitivity, susceptibility and resilience, among others. These elements vary according to the system being analysed and its features 82 . Exposure is the people, livelihoods, species or ecosystems, environmental functions, services, resources, infrastructure or economic, social or cultural assets that could be adversely affected 79 . Figure 6 summarizes the mathematical formulation of the risk assessment approaches employed in this study.
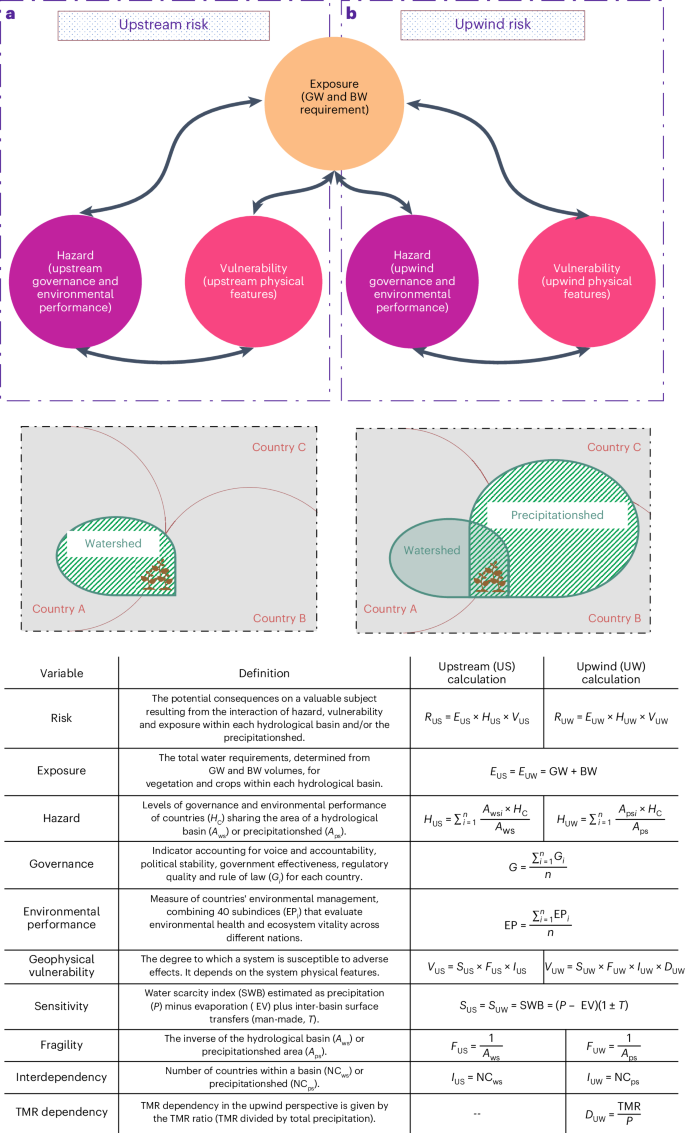
a , b , Conceptual framework for risk assessment from upstream ( a ) and upwind ( b ) perspectives. The diagram illustrates the formulation of risk assessment approaches employed in this study, including the interaction of exposure ( E ), hazard ( H ) and vulnerability ( V ) within each hydrological basin and precipitationshed. The components of exposure (GW and BW requirements), hazard (governance and environmental performance) and vulnerability (sensitivity, fragility, interdependence and TMR dependency) are integrated to evaluate the potential consequences on water security.
The traditional ‘upstream’ perspective analyses hazard and geophysical vulnerability within the boundaries of the hydrological basin and its surface water supply. The ‘upwind perspective’ focuses on hazard and geophysical vulnerability across the upwind areas contributing to the basins’ moisture supply (that is, precipitationshed). Risk assessment frameworks to categorize worldwide basins according to their transboundary water security are given by equations ( 1 ) and ( 2 ):
where R is the risk, E is the exposure (that is, water requirements for vegetation and crops), H is the hazard and V is the geophysical vulnerability. The subscripts denote the perspective used (US for upstream and UW for upwind). We now describe each risk component and any particularity related to each perspective. All risk components are categorized into five groups defined using the quantiles of the distributions across the sample of 379 hydrological basins: very high, high, middle, low and very low. We also normalized the values across the sample of the 379 transboundary basins from 0 to 1 using a min–max normalization.
We frame the exposed asset of the risk assessment as the total water requirements for vegetation and crops, which are determined from the long-term annual requirements of GW and BW volumes for vegetation and crops within each hydrological basin. The exposure is the same for both upstream ( E US ) and upwind perspectives ( E UW ), relating to water requirements within the basin (equation ( 3 )).
GW is defined as the fraction of precipitation that infiltrates into the soil and is then evaporated or transpired by vegetation and crops. BW is the freshwater in surface and groundwater resource usually provided to vegetation or crops through irrigation and then evaporated or transpired. Estimations of GW and BW are obtained from a global gridded (5 arcminute) dataset of annual green and blue long-term water requirements of all land covers, natural and anthropogenic, existing within each hydrological basin during the analysis period (2008–2017). Agricultural land covers present 23 types of crop and three crop groups from the Global Spatially-Disaggregated Crop Production Statistics Data (also known as Spatial Production Allocation Mode, or SPAM) for 2010. These estimations were performed using the WATNEEDS model 83 , assessing the vertical component of the soil water balance, computing evaporation on each watershed area unit of the hydrological basin with the Penman–Monteith method 84 as modified by Allen et al. 85 . Overland flow is calculated as a soil water saturation excess mechanism and percolation is a linear function of the maximum infiltration rate and soil moisture. For a detailed description of the WATNEEDS model, we refer the reader to Chiarelli et al. 83 . Data used to calculate water requirements are reported in Table 1 .
Although the Intergovernmental Panel on Climate Change commonly uses the term hazard for climate-related physical events, trends or their physical impacts 81 , we here focus on potential human-induced hazards related to levels of governance and environmental performance. For human-induced hazards, features related to societal issues indicate the type of activity that may threaten a given system. A thorough threat assessment requires collecting information on potential threat activities within each country. Traditionally, relevant public indices have been used for this 86 . We calculated long-term hazard ( H C ) during 2008–2017 at a country scale emerging from low levels of governance ( G ) and environmental performance (EP) as (equation ( 4 ) and Supplementary Fig. 2 )
For this, we used the five World Bank’s Governance subindices for each country ( G i ) reported during 2008–2017 87 , addressing fundamental aspects of governance: (1) voice and accountability, examining the degree of civil society involvement in governmental processes, (2) political stability, focusing on the likelihood of political instability and violence, (3) government effectiveness, evaluating the government’s capacity to implement policies and provide services efficiently, (4) regulatory quality, highlighting the transparency and effectiveness of regulatory frameworks, and (5) rule of law, measuring the fair and equitable application of laws. We used the long-term average of these subindices to estimate each country’s level of governance (equation ( 5 )), where n is the number of years.
In summary, voice and accountability measure political, civil and human rights and relate to the level of participation in selecting government and the freedom of expression, association and free media 87 . A decrease in voice and accountability can, for instance, disregard the call from citizens to control or curve environmental degradation that may lead to modifications of vapour flows travelling downwind by activities such as deforestation.
Political stability measures the likelihood of violent threats to, or changes in, government, including terrorism, and can relate to the level of bellicosity of a government to generate changes that may affect the moisture supply downstream or downwind. For instance, low political instability would hamper the control of illegal practices fuelling environmental degradation, such as illicit agricultural expansion and mining.
Government effectiveness visualizes the competence of the bureaucracy and the quality of public service delivery, and a low value would imply a limited capacity of the government to control environmental degradation per se. Regulatory quality measures the incidence of policies that are unfriendly to markets. It also refers to a country’s internationalization level and immersion in the international agenda by international commitments and regulations.
Regulatory quality would directly target the issues related to shared political institutions (such as international political and legal arrangements). It also represents the complexity of political frameworks considering different levels of organization (scales), for example, multiple countries (for example, the European Union), or inside countries (there are also problems inside countries, for example, among states sharing the Colorado River in the USA). Hence, a low regulatory quality will imply a higher water security hazard.
Rule of law shows the measuring perceptions of the extent to which agents have confidence in and abide by the rules of society, mostly concerning the quality of contract enforcement, the police and the courts and the likelihood of crime and violence. A low score of rule and law increases the hazard of water security. Finally, the control of corruption, which measures corruption and state capture, also relates to the potential of controlling and avoiding environmental degradation. A low score also implies a higher hazard of water security.
These subindices are combined to offer a holistic view of governance in each country, enabling meaningful comparisons on a global scale. Furthermore, we used the 40 subindices of the Environmental Performance Index by the Yale Center for Environmental Law and Policy 88 . This comprehensive measure of the countries’ environmental management evaluates environmental health and ecosystem vitality across different nations. The index considers indicators such as water resources management, biodiversity conservation and climate change mitigation efforts. Some of these subindices are pertinent for the upstream and upwind risks to water security, as they relate directly to land use changes that may potentially affect downwind moisture supply. These include tree cover loss, grassland loss, wetland loss and terrestrial biome protection. By analysing these factors, the index provides insights into a country’s environmental policies, their effectiveness and areas for improvement. This index is valuable for policymakers and researchers to assess progress and prioritize actions towards sustainable development and environmental protection globally. We know that several subindices of the environmental performance metric are not related to water and land cover environmental characteristics. However, we prefer to use the full metric as a holistic proxy of environmental performance relevant to water security rather than arbitrarily selecting and dropping specific subindices. Thus, we calculated the environmental performance as the long-term average of these 40 subindices (EP i ) (equation ( 6 )), where n is the number of years.
Upstream hazard was calculated for each hydrological basin as an area-weighted average for all countries within the hydrological basin ( H US ; equation ( 7 )). Upwind hazard ( H UW ) was calculated similarly but using the precipitationshed area instead of the hydrological basin area (equation ( 8 )). The n is the number of countries sharing the basin or precipitationshed.
Here A ws and A ps represent the areas for each ( i ) of the total countries ( n ) falling in the hydrological basin and precipitationshed, respectively.
Geophysical vulnerability
Vulnerability is a physical feature used for quantifying risk 76 . This study calculated geophysical vulnerability ( V ) as a function of different physical variables, which sometimes differed between both perspectives. From an upstream perspective (equation ( 9 )), vulnerability is a function of hydrological basin features: sensitivity ( S ), fragility ( F ) and interdependency ( I ). From an upwind perspective (equation ( 10 )), we added one more variable related to TMR dependency ( D ). Fragility and interdependency were adjusted to the spatial extent of the precipitationshed to represent the physical links established by upwind moisture dependency. Again, subscripts denote the perspective used (US, upstream; UW, upwind).
Sensitivity
Sensitivity is calculated from a min–max normalized water scarcity index estimated as precipitation ( P ) minus actual evaporation (EV) plus inter-basin surface transfers (man-made, T ). Precipitation and actual evaporation are based on data from ERA5 from 2008 to 2017, which estimate the long-term mean of surface water balance (SWB) 89 . For inter-basin surface transfers, we have gathered data on transfers from several references, most importantly from Dynesius and Nilsson 90 , who document inter-basin transfers in 139 hydrological basins worldwide. They report the amount of freshwater transferred as a percentage of the runoff before any manipulation. The data even specify if the effect of the inter-basin transfer is negative or positive. Hence, we adjust the values of P – EV originally obtained from ERA5 data with this estimate accordingly. For other basins not included in the work of Dynesius and Nilsson 90 , we have also relied on different sources mentioned in the global assessment of Nilsson et al. 91 and other sources such as Dobbs et al. 92 and Gupta and van der Zaag 93 . Note that the data on inter-basin transfers may not agree with the ERA5 data, yet we have to assume that the amount of water transferred is constant in time and that some inter-basin transfers may not be reported in these databases.
We used the same sensitivity estimate for both perspectives (equation ( 11 )). To homogenize the values across the sample of the 379 transboundary basins, all N values were normalized from 0 to 1 (equations ( 12 ) and ( 13 )) using the maximum (SWB MAX ) and minimum (SWB MIN ) values of the sample. We inverted the value so that higher values represent more sensitivity to upwind or upstream changes in water availability due to less water running on the hydrological basin’s surface, which agrees with higher risk corresponding to higher sensitivity. We assume that the water requirements are less vulnerable to governance and environmental performance changes when more water is available in the hydrological basin.
From the upstream perspective (equation ( 14 )), fragility relates to the inverse of the area of the hydrological basin ( A ws ), while from an upwind standpoint (equation ( 15 )), it relates to that of the precipitationshed ( A ps ) (Supplementary Fig. 5 ). To homogenize the values across the sample of the 379 transboundary basins, all values were normalized from 0 to 1. From the first perspective, we assume that the socioecological system and capacity to meet the freshwater requirements within the hydrological basin is more fragile to changes in governance and environmental performance in smaller hydrological basins than in large basins. For instance, in a larger basin, it is most likely that, while some freshwater requirements are affected in some parts of the hydrological basin, other parts will not experience such affectation. On the contrary, in a small hydrological basin, all freshwater requirements will most possibly be affected similarly 52 , 94 . In the upwind perspective, a similar logic is proposed: the freshwater requirements in a hydrological basin will be less affected when the basin has a large precipitationshed, as the particular hazard in an upwind country may not be as representative when other countries and land areas are involved.
Interdependency
From the upstream perspective (equation ( 16 )), interdependency is estimated from the number of countries within a basin (NC ws ). From the upwind perspective (equation ( 17 )), this variable depends on the countries sharing the precipitationshed (NC ps ). For both perspectives, high values represent a high interdependency with cooperation concerning water resources more difficult between several countries 95 . The assumption is that it will be easier to establish management measures and cooperation if the number of countries is lower. We must state that the level of cooperation in water governance does not strictly depend on the number of countries but also on other factors related to governance, which, for this particular assessment, we include as part of the hazard (see ‘Hazard’ section). To homogenize the values across the sample of the 379 transboundary basins, all values were normalized from 0 to 1.
TMR dependency
The TMR dependency in the upwind perspective (Duw; equation ( 18 )) relates to the contribution of continental evaporation to precipitration in the hydrological basin (Pc). The higher the value, the higher the dependency on TMR.
Finally, we explored collinearity between all variables involved in the risk assessment. As a summary, we found that the variables involved in calculating risk show low collinearity in both perspectives (Supplementary Tables 3 and 4 ), indicating that risk results from nonlinear interactions between its components. Upstream interdependency (that is, the number of countries upstream) correlates highly with upstream risk (Supplementary Table 1 ). From the upwind perspective, we found a high correlation between interdependency and vulnerability (Supplementary Table 5 ).
Characterizing TMR ratio in worldwide basins
We used the vectorized polygon dataset from the Major River Basins of the World project of the Global Runoff Data Centre to extract the large hydrological basins used in our risk assessments 96 . This dataset incorporates data from the HydroSHEDS database 97 and provides the boundaries of 405 river basins. A total of 26 of these basins are not transboundary from the viewpoint of neither the upwind nor the upstream perspectives.
We quantified the TMR ratio in all basins on the basis of the tracking simulation performed by Tuinenburg et al. 74 using the UTrack model 98 at 1.0° resolution (available at https://doi.pangaea.de/10.1594/PANGAEA.912710 ). This simulation spans from 2008 to 2017 and presents monthly climatological means for recycling. Correspondingly, we use this period as the reference for our risk assessments. The UTrack is a Lagrangian moisture tracking numerical algorithm used to study worldwide atmospheric moisture transport processes 99 , 100 , 101 , 102 , 103 . The model tracks parcels of moisture through the atmosphere from their evaporation sources to precipitation sinks. First, evaporated moisture from the land surface is released into atmospheric parcels. Next, atmospheric trajectories for each parcel are calculated, and finally, the moisture contribution to precipitation in each grid cell for each parcel is allocated. For a further detailed description of the UTrack, refer to Tuinenburg and Staal 98 . Calculations of TMR ratio (that is, precipitation fraction with terrestrial origin) used data of precipitation, precipitable water, evaporation, wind speed and direction obtained from the ERA5 reanalysis on a 0.25° global grid.
To obtain the TMR ratio of a hydrological basin, we took all evaporation contribution fractions from the continental sources towards each basin and multiplied them with evaporation to estimate the moisture flow. Finally, we summed these fluxes and divided them by the total precipitation over the basin. Finally, for validation and assessing uncertainty, we compared for specific hydrological basins the TMR dependency results obtained with UTrack with those obtained with simulations using the Eulerian WAM2-Layers model 104 (see Supplementary Fig. 7 and the ‘Uncertainty analysis’ section).
Structuring the transboundary precipitationshed
Keys et al. 20 define a precipitationshed as the upwind surface areas providing evaporation as a contribution to precipitation in a determined location. The precipitationshed is then calculated using polygons to delimit regions according to contribution levels. Previous studies have suggested and discussed different thresholds to delimit a precipitationshed boundary of continental recycled precipitation (for example, 70% (ref. 20 ) and 40% (ref. 50 )). We here used a higher value (80%) based on (1) an uncertainty exploration (Supplementary Fig. 7b,c ), (2) the moisture tracking state of the art (it is higher than the minimum required to delineate our precipitationsheds 50 ) and (3) the need for high representativeness of continental sources.
We used the UTrack dataset to delimit the transboundary precipitationshed for each hydrological basin. First, we took evaporation contribution fluxes from the continental sources towards each basin; next, we divided these values by each basin’s total precipitation to obtain the continental precipitation recycling ratio per pixel. Finally, we used these values to delimit the regions according to contribution levels. Following Weng et al. 50 , we used the terrestrial component of precipitationsheds in our calculations because land surface alterations in each country could directly impact the TMR. The estimation of TMR and precipitationshed extent from the UTrack dataset is justified by the lower computational costs compared with those when performing a tracking simulation. Furthermore, the UTrack simulation that generates this dataset uses the ERA5 data with a 0.25° high-resolution climatological dataset. We explored the uncertainty in our estimates of precipitationsheds’ extensions by comparing those from the ten largest worldwide basins using WAM2-Layers (Supplementary Fig. 7b,c ).
Uncertainty analysis
We studied uncertainty in our results related to the hazard and the physical links introduced by upwind dependencies. First, we analysed the sensitivity of the results regarding the risk arising from different governance and environmental performance values by using twice the standard deviations of all their subindices during 2008–2017, generating a range of possible results (Supplementary Fig. 8 ).
Furthermore, uncertainty from tracking moisture simulations arises because these models use a simplified representation of the real-world and climatological data. To explore these uncertainties, we compared the estimated TMR dependency and precipitationshed from the UTrack dataset with simulations using WAM2-Layers in the ten largest basins worldwide. These models present different physical approaches (Lagrangian versus Eulerian) and climatological inputs (ERA5 versus ERA-Interim, with 0.25° and 1.5° of spatial resolution, respectively). This comparison was constrained to a few hydrological basins owing to the high computational costs of using WAM2-Layers to estimate the extension of precipitationsheds. Unfortunately, the previous tracking simulation dataset using this model 104 does not allow us to estimate the extension of the precipitationshed. For further details on the uncertainty analysis, see Supplementary Information .
Data availability
Data results are available via Zenodo at https://doi.org/10.5281/zenodo.11474249 (ref. 105 ) with CCA 4.0 licence.
Code availability
Code used to delimit continental precipitationsheds from UTrack dataset is available via GitHub at https://github.com/josepomarin/PshedUTrack.git .
van der Ent, R. J., Savenije, H. H. G., Schaefli, B. & Steele-Dunne, S. C. Origin and fate of atmospheric moisture over continents. Water Resour. Res. 46 , 1–12 (2010).
Article Google Scholar
van der Ent, R. J., Wang-Erlandsson, L., Keys, P. W. & Savenije, H. H. G. Contrasting roles of interception and transpiration in the hydrological cycle—part 2: moisture recycling. Earth Syst. Dynam. 5 , 471–489 (2014).
Gordon, L. J. et al. Human modification of global water vapor flows from the land surface. Proc. Natl Acad. Sci. USA 102 , 7612–7617 (2005).
Article PubMed PubMed Central CAS Google Scholar
Wang-Erlandsson, L. et al. Remote land use impacts on river flows through atmospheric teleconnections. Hydrol. Earth Syst. Sci. 22 , 4311–4328 (2018).
te Wierik, S. A., Cammeraat, E. L. H., Gupta, J. & Artzy-Randrup, Y. A. Reviewing the impact of land use and land-use change on moisture recycling and precipitation patterns. Water Resour. Res. 57 , e2020WR029234 (2021).
Destouni, G., Jaramillo, F. & Prieto, C. Hydroclimatic shifts driven by human water use for food and energy production. Nat. Clim. Change 3 , 213–217 (2013).
Ruiz-Vásquez, M., Arias, P. A., Martínez, J. A. & Espinoza, J. C. Effects of Amazon basin deforestation on regional atmospheric circulation and water vapor transport towards tropical South America. Clim. Dyn. 54 , 4169–4189 (2020).
Jaramillo, F. & Destouni, G. Local flow regulation and irrigation raise global human water consumption and footprint. Science 350 , 1248–1251 (2015).
Article PubMed CAS Google Scholar
Creed, I. F. et al. Changing forest water yields in response to climate warming: results from long-term experimental watershed sites across North America. Global Change Biol. 20 , 3191–3208 (2014).
Hegerl, G. C. et al. Challenges in quantifying changes in the global water cycle. Bull. Am. Meteorol. Soc. 96 , 1097–1115 (2015).
Badger, A. M. & Dirmeyer, P. A. Climate response to Amazon forest replacement by heterogeneous crop cover. Hydrol. Earth Syst. Sci. 19 , 4547–4557 (2015).
Bagley, J. E., Desai, A. R., Dirmeyer, P. A. & Foley, J. A. Effects of land cover change on moisture availability and potential crop yield in the worlds breadbaskets. Environ. Res. Lett. 7 , 014009 (2012).
Dirmeyer, P. A. & Brubaker, K. L. Contrasting evaporative moisture sources during the drought of 1988 and the flood of 1993. J. Geophys. Res. Atmos. 104 , 19383–19397 (1999).
Dominguez, F., Kumar, P., Liang, X.-Z. & Ting, M. Impact of atmospheric moisture storage on precipitation recycling. J. Clim. 19 , 1513–1530 (2006).
Keys, P. W., Wang-Erlandsson, L. & Gordon, L. J. Revealing invisible water: moisture recycling as an ecosystem service. PLoS ONE 11 , e0151993 (2016).
Article PubMed PubMed Central Google Scholar
Lo, M.-H. & Famiglietti, J. S. Irrigation in California’s Central Valley strengthens the southwestern U.S. water cycle. Geophys. Res. Lett. 40 , 301–306 (2013).
Salih, A. A. M., Körnich, H. & Tjernström, M. Climate impact of deforestation over South Sudan in a regional climate model. Int. J. Climatol. 33 , 2362–2375 (2013).
Swann, A. L. S., Longo, M., Knox, R. G., Lee, E. & Moorcroft, P. R. Future deforestation in the Amazon and consequences for South American climate. Agric. For. Meteorol. 214–215 , 12–24 (2015).
Keune, J., Sulis, M., Kollet, S., Siebert, S. & Wada, Y. Human water use impacts on the strength of the continental sink for atmospheric water. Geophys. Res. Lett. 45 , 4068–4076 (2018).
Keys, P. W. et al. Analyzing precipitationsheds to understand the vulnerability of rainfall dependent regions. Biogeosciences 9 , 733–746 (2012).
Piemontese, L. et al. Estimating the global potential of water harvesting from successful case studies. Global Environ. Change 63 , 102121 (2020).
Lawrence, D. & Vandecar, K. Effects of tropical deforestation on climate and agriculture. Nat. Clim. Change 5 , 27–36 (2015).
Stickler, C. M. et al. Dependence of hydropower energy generation on forests in the Amazon Basin at local and regional scales. Proc. Natl Acad. Sci. USA 110 , 9601–9606 (2013).
Li, D., Wu, S., Liu, L., Zhang, Y. & Li, S. Vulnerability of the global terrestrial ecosystems to climate change. Global Change Biol. 24 , 4095–4106 (2018).
Côté, I. M. & Darling, E. S. Rethinking ecosystem resilience in the face of climate change. PLoS Biol. 8 , e1000438 (2010).
Fahrländer, S. F., Wang-Erlandsson, L., Jaramillo, F. & Pranindita, A. Hydroclimatic vulnerability of wetlands to upwind land use changes. Earth's Future 12 , e2023EF003837 (2024).
Keys, P. W., Wang-Erlandsson, L. & Gordon, L. J. Megacity precipitationsheds reveal tele-connected water security challenges. PLoS ONE 13 , e0194311 (2018).
Keys, P. W., Wang-Erlandsson, L., Gordon, L. J., Galaz, V. & Ebbesson, J. Approaching moisture recycling governance. Global Environ. Change 45 , 15–23 (2017).
Posada-Marín, J. A. & Salazar, J. F. River flow response to deforestation: contrasting results from different models. Water Security 15 , 100115 (2022).
Ahlström, H. et al. An earth system law perspective on governing social-hydrological systems in the Anthropocene. Earth Syst. Govern. 10 , 100120 (2021).
Rockström, J., Mazzucato, M., Andersen, L. S., Fahrländer, S. F. & Gerten, D. Why we need a new economics of water as a common good. Nature 615 , 794–797 (2023).
Article PubMed Google Scholar
Keune, J. & Miralles, D. G. A precipitation recycling network to assess freshwater vulnerability: challenging the watershed convention. Water Resour. Res. 55 , 9947–9961 (2019).
te Wierik, S. A., Gupta, J., Cammeraat, E. L. H. & Artzy-Randrup, Y. A. The need for green and atmospheric water governance. WIREs Water 7 , e1406 (2020).
Salazar, A. et al. Peace and the environment at the crossroads: elections in a conflict-troubled biodiversity hotspot. Environ. Sci. Policy 135 , 77–85 (2022).
Fischer, R., Giessen, L. & Günter, S. Governance effects on deforestation in the tropics: a review of the evidence. Environ. Sci. Policy 105 , 84–101 (2020).
Larson, A. M., Sarmiento Barletti, J. P. & Heise Vigil, N. A place at the table is not enough: accountability for Indigenous Peoples and local communities in multi-stakeholder platforms. World Dev. 155 , 105907 (2022).
United Nations Secretary-General. 71st Report of the Open-ended Intergovernmental Expert Working Group on Indicators and Terminology relating to Disaster Risk Reduction (UNDRR, 2017).
Vörösmarty, C. J. et al. Global threats to human water security and river biodiversity. Nature 467 , 555–561 (2010).
Hall, J. & Borgomeo, E. Risk-based principles for defining and managing water security. Philos. Trans. R. Soc. A 371 , 20120407 (2013).
Garrick, D. & Hall, J. W. Water security and society: risks, metrics, and pathways. Annu. Rev. Environ. Resour. 39 , 611–639 (2014).
Shi, R., Wang, T., Yang, D. & Yang, Y. Streamflow decline threatens water security in the upper Yangtze river. J. Hydrol. 606 , 127448 (2022).
Drenkhan, F. et al. Looking beyond glaciers to understand mountain water security. Nat. Sustain. 6 , 130–138 (2023).
Sobhani, P. et al. Assessing water security and footprint in hypersaline Lake Urmia. Ecol. Indic. 155 , 110955 (2023).
Bergier, I. et al. Amazon rainforest modulation of water security in the Pantanal wetland. Sci. Total Environ. 619–620 , 1116–1125 (2018).
Castle, S. L. et al. Groundwater depletion during drought threatens future water security of the Colorado River Basin. Geophys. Res. Lett. 41 , 5904–5911 (2014).
Chawla, I., Karthikeyan, L. & Mishra, A. K. A review of remote sensing applications for water security: quantity, quality, and extremes. J. Hydrol. 585 , 124826 (2020).
Article CAS Google Scholar
Rijsberman, F. R. Water scarcity: fact or fiction? Agric. Water Manage. 80 , 5–22 (2006).
Hanemann, W. M. The economic conception of water. in Water Crisis: Myth or Reality? (eds Rogers, P. P., Llamas, M. R. & Martinez-Cortina, L.) 61–91 (Taylor & Francis, 2006).
Loomis, R. A. Y. & John, B. Determining the Economic Value of Water: Concepts and Methods (Routledge, 2014).
Google Scholar
Weng, W., Luedeke, M., Zemp, D., Lakes, T. & Kropp, J. Aerial and surface rivers: downwind impacts on water availability from land use changes in Amazonia. Hydrol. Earth Syst. Sci. 22 , 911–927 (2018).
Cohen, A. Rescaling environmental governance: watersheds as boundary objects at the intersection of science, neoliberalism, and participation. Environ. Plan A 44 , 2207–2224 (2012).
Coe, M. T., Costa, M. H. & Soares-Filho, B. S. The influence of historical and potential future deforestation on the stream flow of the Amazon River–Land surface processes and atmospheric feedbacks. J. Hydrol. 369 , 165–174 (2009).
Sørensen, R. et al. Forest harvest increases runoff most during low flows in two boreal streams. Ambio 38 , 357–363 (2009).
Loarie, S. R., Lobell, D. B., Asner, G. P., Mu, Q. & Field, C. B. Direct impacts on local climate of sugar-cane expansion in Brazil. Nat. Clim. Change 1 , 105–109 (2011).
Qiu, G. Y., Xie, F., Feng, Y. C. & Tian, F. Experimental studies on the effects of the ‘Conversion of Cropland to Grassland Program’ on the water budget and evapotranspiration in a semi-arid steppe in Inner Mongolia, China. J. Hydrol. 411 , 120–129 (2011).
Sterling, S. M., Ducharne, A. & Polcher, J. The impact of global land-cover change on the terrestrial water cycle. Nat. Clim. Change 3 , 385–390 (2013).
Bosch, J. M. & Hewlett, J. D. A review of catchment experiments to determine the effect of vegetation changes on water yield and evapotranspiration. J. Hydrol. 55 , 3–23 (1982).
Martin, P., Rosenberg, N. J. & McKenney, M. S. Sensitivity of evapotranspiration in a wheat field, a forest, and a grassland to changes in climate and direct effects of carbon dioxide. Clim. Change 14 , 117–151 (1989).
Costa, M. H. & Foley, J. A. Combined effects of deforestation and doubled atmospheric CO 2 concentrations on the climate of Amazonia. J. Clim. 13 , 18–34 (2000).
Andréassian, V. Waters and forests: from historical controversy to scientific debate. J. Hydrol. 291 , 1–27 (2004).
Ellison, D., N. Futter, M. & Bishop, K. On the forest cover–water yield debate: from demand‐ to supply‐side thinking. Global Change Biol. 18 , 806–820 (2012).
D’Almeida, C. et al. The effects of deforestation on the hydrological cycle in Amazonia: a review on scale and resolution. Int. J. Climatol. 27 , 633–647 (2007).
Sierra, J. P. et al. Deforestation impacts on Amazon-Andes hydroclimatic connectivity. Clim. Dynam. 58 , 2609–2636 (2022).
Wolf, A. T. A long-term view of water and security: international waters, national issues and regional tensions. J Contemp. Wat. Res. Ed. 142 , 67–75 (2009).
Nasr, H. & Neef, A. Ethiopia’s challenge to Egyptian hegemony in the Nile River Basin: the case of the grand Ethiopian Renaissance Dam. Geopolitics 21 , 969–989 (2016).
Petersen-Perlman, J. D., Veilleux, J. C. & Wolf, A. T. International water conflict and cooperation: challenges and opportunities. Water Int. 42 , 105–120 (2017).
Elsayed, H., Djordjević, S., Savić, D. A., Tsoukalas, I. & Makropoulos, C. The Nile water–food–energy nexus under uncertainty: impacts of the Grand Ethiopian Renaissance Dam. J. Water Resour. Plan. Manage. 146 , 04020085 (2020).
Wolf, A. T. Transboundary water conflicts and cooperation. in Allocating and Managing Water for a Sustainable Future: Lessons from Around the World (Summer Conference, June 11 – 14) (2002).
Rai, S. P., Wolf, A. T., Sharma, N., & Tiwari, H. Hydropolitics in transboundary water conflict and cooperation. in River System Analysis and Management (ed. Sharma, N.) 353–368 (Springer Singapore, 2017).
Turgul, A. et al. Reflections on transboundary water conflict and cooperation trends. Water Int. 49 , 274–288 (2024).
Pereira, E. J. D. A. L., de Santana Ribeiro, L. C., da Silva Freitas, L. F. & de Barros Pereira, H. B. Brazilian policy and agribusiness damage the Amazon rainforest. Land Use Policy 92 , 104491 (2020).
Levy, B. S. & Sidel, V. W. Water rights and water fights: preventing and resolving conflicts before they boil over. Am. J. Public Health 101 , 778–780 (2011).
Butsic, V., Baumann, M., Shortland, A., Walker, S. & Kuemmerle, T. Conservation and conflict in the Democratic Republic of Congo: the impacts of warfare, mining, and protected areas on deforestation. Biol. Conserv. 191 , 266–273 (2015).
Tuinenburg, O. A., Theeuwen, J. J. & Staal, A. High-resolution global atmospheric moisture connections from evaporation to precipitation. Earth Syst. Sci. Data 12 , 3177–3188 (2020).
Nyasulu, M. K. et al. African rainforest moisture contribution to continental agricultural water consumption. Agric. For. Meteorol. 346 , 109867 (2024).
Gain, A. K. & Giupponi, C. A dynamic assessment of water scarcity risk in the Lower Brahmaputra River Basin: an integrated approach. Ecol. Indic. 48 , 120–131 (2015).
Krueger, E. H. et al. Resilience dynamics of urban water supply security and potential of tipping points. Earth’s Future 7 , 1167–1191 (2019).
D’Odorico, P. et al. The global food–energy–water nexus. Rev. Geophys. 56 , 456–531 (2018).
Abbott, B. W. et al. Human domination of the global water cycle absent from depictions and perceptions. Nat. Geosci. 12 , 533–540 (2019).
Moore, M.-L. et al. Moving from fit to fitness for governing water in the Anthropocene. Nat Water 2 , 511–520 (2024).
Reisinger, A. et al. The concept of risk in the IPCC Sixth Assessment Report: a summary of cross-working group discussions. IPCC https://www.ipcc.ch/site/assets/ (2020).
Estoque, R. C. et al. Has the IPCC’s revised vulnerability concept been well adopted? Ambio 52 , 376–389 (2023).
Chiarelli, D. D. et al. The green and blue crop water requirement WATNEEDS model and its global gridded outputs. Sci. Data 7 , 273 (2020).
Harris, I., Jones, P. D., Osborn, T. J. & Lister, D. H. Updated high-resolution grids of monthly climatic observations—the CRU TS3.10 dataset. Int. J. Climatol. 34 , 623–642 (2014).
Allan, R. G., Pereira, L. S., Raes, D. & Smith, M. Crop Evapotranspiration—Guidelines for Computing Crop Water Requirements (FAO, 1998).
Caldara, D. & Lacoviello, M. Measuring geopolitical risk. Am. Econ. Rev. 112 , 1194–1225 (2022).
Kaufmann, D. & Kraay, A. Governance indicators: where are we, where should we be going? World Bank Res. Observ. 23 , 1–30 (2008).
Hsu, A., & Zomer, A. Environmental performance index. in Wiley StatsRef: Statistics Reference Online (John Wiley & Sons, 2014).
Schyns, J. F., Hoekstra, A. Y. & Booij, M. J. Review and classification of indicators of green water availability and scarcity. Hydrol. Earth Syst. Sci. 19 , 4581–4608 (2015).
Dynesius, M. & Nilsson, C. Fragmentation and flow regulation of river systems in the northern third of the world. Science 266 , 753–762 (1994).
Nilsson, C., Reidy, C. A., Dynesius, M. & Revenga, C. Fragmentation and flow regulation of the world’s large river systems. Science 308 , 405–408 (2005).
Dobbs, G. R. et al. Inter-basin surface water transfers database for public water supplies in conterminous United States, 1986–2015. Sci. Data 10 , 255 (2023).
Gupta, J. & van der Zaag, P. Interbasin water transfers and integrated water resources management: where engineering, science and politics interlock. Phys. Chem. Earth Parts A/B/C 33 , 28–40 (2008).
Salazar, J. F. et al. Scaling properties reveal regulation of river flows in the Amazon through a ‘forest reservoir.’. Hydrol. Earth Syst. Sci. 22 , 1735–1748 (2018).
Villar, P. C., Ribeiro, W. C. & Sant’Anna, F. M. Transboundary governance in the La Plata River basin: status and prospects. Water Int. 43 , 978–995 (2018).
Major River Basins of the World/Global Runoff Data Centre (Global Runoff Data Centre (GRDC), 2020).
Lehner, B. & Grill, G. Global river hydrography and network routing: baseline data and new approaches to study the world’s large river systems. Hydrol. Process. 27 , 2171–2186 (2013).
Tuinenburg, O. A. & Staal, A. Tracking the global flows of atmospheric moisture and associated uncertainties. Hydrol. Earth Syst. Sci. 24 , 2419–2435 (2020).
Staal, A. et al. Hysteresis of tropical forests in the 21st century. Nat. Commun. 11 , 4978 (2020).
O’Connor, J. C., Santos, M. J., Dekker, S. C., Rebel, K. T. & Tuinenburg, O. A. Atmospheric moisture contribution to the growing season in the Amazon arc of deforestation. Environ. Res. Lett. 16 , 084026 (2021).
Hoek van Dijke, A. J. et al. Shifts in regional water availability due to global tree restoration. Nat. Geosci. 15 , 363–368 (2022).
Theeuwen, J., Tuinenburg, O., Staal, A., Hamelers, B. & Dekker, S. Moisture recycling in five different regions with Mediterranean climates around the world. Weather 1 , 2 (2022).
Tuinenburg, O. A., Bosmans, J. H. & Staal, A. The global potential of forest restoration for drought mitigation. Environ. Res. Lett. 17 , 034045 (2022).
Posada‐Marín, J. A., Arias, P. A., Jaramillo, F. & Salazar, J. F. Global impacts of El Niño on terrestrial moisture recycling. Geophys. Res. Lett. 50 , e2023GL103147 (2023).
Posada-Marín, J. A., Salazar, J. F., Rulli, M. C., Wang-Erlandsson, L. & Jaramillo, F. Global water security risk assessment . Zenodo https://doi.org/10.5281/zenodo.11474249 (2024).
New, M., Lister, D., Hulme, M. & Makin, I. A high-resolution data set of surface climate over global land areas. Clim. Res. 21 , 1–25 (2002).
Harmonized World Soil Database (Version 1.2) (FAO, 2012).
Groundwater Resources of the World, 1:25,000,000 (BGR/UNESCO, 2012).
Portmann, F. T., Siebert, S. & Doll, P. MIRCA2000-global monthly irrigated and rainfed crop areas around the year 2000: a new high-resolution data set for agricultural and hydrological modeling. Global Biogeochem. Cyc. 24 , GB1011 (2010).
Siebert, K. J., Egi, A. & McCaig, R. Chemometric investigation of barley and malt data. J. Am. Soc. Brew. Chem. 70 , 163–175 (2012).
CAS Google Scholar
Yu, Q. et al. A cultivated planet in 2010—part 2: the global gridded agricultural-production maps. Earth Syst. Sci. Data 12 , 3545–3572 (2020).
Download references
Acknowledgements
This work was funded by the Swedish Research Council for Environment, Agricultural Sciences and Spatial Planning (FORMAS) Project 2022-02148, the Swedish Research Council (VR) Project 2021-05774. J.P.-M. was funded by the Colombian Ministry of Science, Technology and Innovation (Minciencias) through the programme ‘Excelencia doctoral del Bicentenario’ Grant 20230017-25-2020. J.S. was funded by the Colombian Ministry of Science, Technology, and Innovation (Minciencias) through the SOS-Cuenca research programme ‘SOStenibilidad de sistemas ecológicos y sociales en la CUENCA Magdalena-Cauca bajo escenarios de cambio climático y pérdida de bosques’ (grant no. 1115-852-70719). L.W.-E. was supported by funding from FORMAS (2019-01220, 2022-02089, 2023-0310 and 2023-00321), Horizon Europe (101081661), the IKEA Foundation, the Marianne and Marcus Wallenberg Foundation and the Marcus and Amalia Wallenberg Foundation. The funders had no role in the design, data collection and analysis, decision to publish or preparation of the paper.
Open access funding provided by Stockholm University.
Author information
Authors and affiliations.
GIGA, Escuela Ambiental, Facultad de Ingeniería, Universidad de Antioquia, Medellín, Colombia
José Posada-Marín & Juan Salazar
Department of Physical Geography/Bolin Centre for Climate Research, Stockholm University, Stockholm, Sweden
José Posada-Marín & Fernando Jaramillo
Grupo de Investigación en Innovación Digital y Desarrollo Social, IU Digital de Antioquia, Medellín, Colombia
José Posada-Marín
Department of Civil and Environmental Engineering, Politecnico di Milano, Milan, Italy
Maria Cristina Rulli
Stockholm Resilience Centre, Stockholm University, Stockholm, Sweden
Lan Wang-Erlandsson
Anthropocene Laboratory, the Royal Swedish Academy of Sciences, Stockholm, Sweden
Potsdam Institute for Climate Impact Research, Member of the Leibnitz Association, Potsdam, Germany
You can also search for this author in PubMed Google Scholar
Contributions
Design: J.P.-M., J.S. and F.J. Project administration and supervision: F.J. Methodology: J.P.-M., J.S. and F.J. Deployment and sampling: J.P.-M. Formal analysis: J.P.-M., J.S., M.C.R., L.W.-E. and F.J. Writing—original draft: J.P.-M., J.S. and F.J. Writing—review and editing: J.P.-M., J.S., M.C.R., L.W.-E. and F.J. Modelling: J.P.-M. and M.C.R. All authors contributed to discussion of the results and the paper.
Corresponding author
Correspondence to José Posada-Marín .
Ethics declarations
Competing interests.
The authors declare no competing interests.
Peer review
Peer review information.
Nature Water thanks Dionysia Panagoulia and the other, anonymous, reviewer(s) for their contribution to the peer review of this work.
Additional information
Publisher’s note Springer Nature remains neutral with regard to jurisdictional claims in published maps and institutional affiliations.
Supplementary information
Supplementary information.
Supplementary Figs. 1–8 and Tables 1–5.
Source Data Fig. 1
Environmental Performance Index, governance, TMR ratio and area for each of the 379 analysed basins.
Source Data Fig. 2
Hazard from upstream and upwind perspectives, and their differences for each of the 379 analysed basins.
Source Data Fig. 3
Vulnerability from upstream and upwind perspectives, and their differences for each of the 379 analysed basins.
Source Data Fig. 4
Relative amount of total water, GW and BW requirements for each perspective and in each of the five risk categories in each of the 379 analysed basins.
Source Data Fig. 5
Risk category from upstream and upwind perspectives, their changes and area for each of the 379 analysed basins.
Rights and permissions
Open Access This article is licensed under a Creative Commons Attribution 4.0 International License, which permits use, sharing, adaptation, distribution and reproduction in any medium or format, as long as you give appropriate credit to the original author(s) and the source, provide a link to the Creative Commons licence, and indicate if changes were made. The images or other third party material in this article are included in the article’s Creative Commons licence, unless indicated otherwise in a credit line to the material. If material is not included in the article’s Creative Commons licence and your intended use is not permitted by statutory regulation or exceeds the permitted use, you will need to obtain permission directly from the copyright holder. To view a copy of this licence, visit http://creativecommons.org/licenses/by/4.0/ .
Reprints and permissions
About this article
Cite this article.
Posada-Marín, J., Salazar, J., Rulli, M.C. et al. Upwind moisture supply increases risk to water security. Nat Water (2024). https://doi.org/10.1038/s44221-024-00291-w
Download citation
Received : 24 October 2023
Accepted : 15 July 2024
Published : 02 September 2024
DOI : https://doi.org/10.1038/s44221-024-00291-w
Share this article
Anyone you share the following link with will be able to read this content:
Sorry, a shareable link is not currently available for this article.
Provided by the Springer Nature SharedIt content-sharing initiative
Quick links
- Explore articles by subject
- Guide to authors
- Editorial policies
Sign up for the Nature Briefing newsletter — what matters in science, free to your inbox daily.

IMAGES
VIDEO
COMMENTS
Case Study: The Amazon Rainforest The Amazon in context. Tropical rainforests are often considered to be the "cradles of biodiversity." Though they cover only about 6% of the Earth's land surface, they are home to over 50% of global biodiversity. Rainforests also take in massive amounts of carbon dioxide and release oxygen through ...
The study examines the impact of deforestation on the health of the Amazon Rainforest in Rondônia by analysing land use changes from 1975 to 2024 using GIS software (LandSat Explorer, ArcGIS Online, ImageJ) and satellite images. The aim was to identify the main drivers of deforestation and assess the changes in Enhanced Vegetation Index (EVI ...
Case Study: The Amazonian Road Decision. The proposed Pucallpa-Cruzeiro do Sul will connect the Amazon's interior to urban centers and export markets in Peru and Brazil. However, critics are worried that the road will also create new opportunities for illegal logging and infringe on the territory of indigenous communities and wildlife.
Living World - Amazon Case Study The Amazon is the largest tropical rainforest on Earth. It sits within the Amazon River basin, covers some 40% of the South American continent and as you can see on the map below includes parts of eight South American countries: Brazil, Bolivia, Peru, Ecuador, Colombia, Venezuela, Guyana, and Suriname.
Amazon Deforestation: A Regional Conservation Case Study. GIS analysis of select strictly protected areas supported by the Amazon Region Protected Areas Program (ARPA)
Amazon Rainforest: A case for land rights and development. A look into the current successes and failures in the management of the world's biggest tropical rainforest. ... When looking at historically successful case studies of environmental governance, a reading by (Gutierrez et al., 2011) assigned in class examined over 130 fisheries around ...
The planet is on track to reach 2.5 °C of warming by 2100, according to a report released by the United Nations last October. Nobre now wonders whether his earlier study was too conservative ...
The Amazon Rainforest is about the same size as the continental United States. One-fifth of the world's fresh water runs through it, and it is home to more species of animals and plants than anywhere on Earth. The Amazon represents more than half of the remaining rainforests on the planet. This forest is so vast, but it is not indestructible.
Since 2001, 103,079-189,755 km2 of Amazon rainforest has been impacted by fires, potentially impacting the ranges of 77.3-85.2% of species that are listed as threatened in this region5.
Sustainable management ensures rainforests are worth. more than the value of the timber and other resources that can be extracted, such as gold. An example of this is sustainable foresty, which balances the removal of trees to sell with the conservation of the forest. Selective logging involves only removing a small number of trees, allowing ...
The Amazon rainforest area spans about 8,200,000km 2 across 9 countries, making it the largest rainforest in the world. The tree coverage in 1970 was 4.1m km 2 . In 2018, it was 3.3m km 2 . Between 2001 and 2013, the causes of Amazonian deforestation were:
The study area, which represents about 20 percent of the Amazon basin, has lost 30 percent of its rainforest. New results from a nine-year research project in the eastern Amazon rainforest finds that significant deforestation in eastern and southeastern Brazil has been associated with a long-term decrease in rainfall and increase in temperature during the dry season, turning what was once a ...
The study area is defined by the Amazon biogeographic limit (RAISG 2020). The Amazon rainforest comprises different climate zones. According to Köppen-Geiger's classification, the northwest is characterized by a tropical rainforest climate (Af) and monsoon climate (Am). ... (1990-2010 in the case of Gloor et al. 2015), ...
73 Case Study: The Amazon Rainforest The Amazon in context. Tropical rainforests are often considered to be the "cradles of biodiversity." Though they cover only about 6% of the Earth's land surface, they are home to over 50% of global biodiversity. Rain forests also take in massive amounts of carbon dioxide and release oxygen through ...
Early studies showed that the Amazon rainforest may exhibit strong dieback by the end of the twenty-first century 9,19. ... the case of Amazonian rainforest and savanna fire. Ecol.
Selected text level. It's estimated that roughly 20 percent of the Amazon Rainforest has disappeared during the past 50 years. Deforestation due to agriculture , urbanization, and illegal logging is not only threatening the millions of unique plant and animal species native to the Amazon River region, it's affecting humans worldwide.
Study after study has sounded the alarm on the deteriorating Amazon rainforest. Plagued by deforestation, drought, fires and other human disturbances, the iconic ecosystem is teetering on a ...
The Amazon rainforest is one of the world's most unique and important ecosystems. Yet the health of the rainforest and the people who live there is threatene...
Item 1 of 4 Smoke from a fire rises into the air as trees burn amongst vegetation in Brazil's Amazon rainforest, in Apui, Amazonas state, Brazil, September 5, 2021. ... One study last year ...
It was the main driver of the Amazon rainforest's worst drought in at least half a century, according to a new study. Often described as the "lungs of the planet", the Amazon plays a key role in ...
That month, the country's National Institute for Space Research (INPE) reported that there were more than 80,000 fires, the most that it had ever recorded. It was a nearly 80 percent jump ...
why does the Amazon receive so much rainfall? - it is located near the equator which means it receives lots of solar radiation. - this heats the air, which then rises during evapotranspiration. - it then cools and condenses to form rainfall. - because it is constantly warm, this cycle of evapotranspiration etc continues annually so there is a ...
Case Study: The Amazon Rainforest The Amazon in context. Tropical rainforests are often considered to be the "cradles of biodiversity." Though they cover only about 6% of the Earth's land surface, they are home to over 50% of global biodiversity. Rainforests also take in massive amounts of carbon dioxide and release oxygen through ...
D.C. also has separate, ratepayer-funded heat pump rebates, which predate the 2022 law and came to about $350 in my case. (If I had bought a more efficient model, that D.C. rebate would have been ...
While studies 4,5,7,20,26,50,62,63 already point to the corresponding heterogeneous effects of land and water use changes on moisture supply downwind, this study rather focuses on the factors of ...