Chapter 3: Probability Topics

Chapter 3 Homework
Section 3.1.

The graph in [link] displays the sample sizes and percentages of people in different age and gender groups who were polled concerning their approval of Mayor Ford’s actions in office. The total number in the sample of all the age groups is 1,045.
- Define three events in the graph.
- Describe in words what the entry 40 means.
- Describe in words the complement of the entry in question 2.
- Describe in words what the entry 30 means.
- Out of the males and females, what percent are males?
- Out of the females, what percent disapprove of Mayor Ford?
- Out of all the age groups, what percent approve of Mayor Ford?
- Find P (Approve|Male).
- Out of the age groups, what percent are more than 44 years old?
- Find P (Approve|Age < 35).
Explain what is wrong with the following statements. Use complete sentences.
- If there is a 60% chance of rain on Saturday and a 70% chance of rain on Sunday, then there is a 130% chance of rain over the weekend.
- The probability that a baseball player hits a home run is greater than the probability that he gets a successful hit.
- You can’t calculate the joint probability knowing the probability of both events occurring, which is not in the information given; the probabilities should be multiplied, not added; and probability is never greater than 100%
- A home run by definition is a successful hit, so he has to have at least as many successful hits as home runs.
Section 3.2
Use the following information to answer the next 12 exercises. The graph shown is based on more than 170,000 interviews done by Gallup that took place from January through December 2012. The sample consists of employed Americans 18 years of age or older. The Emotional Health Index Scores are the sample space. We randomly sample one Emotional Health Index Score.

Find the probability that an Emotional Health Index Score is 82.7.
Find the probability that an Emotional Health Index Score is 81.0.
Find the probability that an Emotional Health Index Score is more than 81?
Find the probability that an Emotional Health Index Score is between 80.5 and 82?
If we know an Emotional Health Index Score is 81.5 or more, what is the probability that it is 82.7?
What is the probability that an Emotional Health Index Score is 80.7 or 82.7?
What is the probability that an Emotional Health Index Score is less than 80.2 given that it is already less than 81.
What occupation has the highest emotional index score?
Physician (83.7)
What occupation has the lowest emotional index score?
What is the range of the data?
83.7 − 79.6 = 4.1
Compute the average EHIS.
If all occupations are equally likely for a certain individual, what is the probability that he or she will have an occupation with lower than average EHIS?
P (Occupation < 81.3) = 0.5
Bringing It Together
A previous year, the weights of the members of the San Francisco 49ers and the Dallas Cowboys were published in the San Jose Mercury News . The factual data are compiled into [link] .
| Shirt# | ≤ 210 | 211–250 | 251–290 | 290≤ |
|---|---|---|---|---|
| 1–33 | 21 | 5 | 0 | 0 |
| 34–66 | 6 | 18 | 7 | 4 |
| 66–99 | 6 | 12 | 22 | 5 |
For the following, suppose that you randomly select one player from the 49ers or Cowboys.
If having a shirt number from one to 33 and weighing at most 210 pounds were independent events, then what should be true about P (Shirt# 1–33|≤ 210 pounds)?
The probability that a male develops some form of cancer in his lifetime is 0.4567. The probability that a male has at least one false positive test result (meaning the test comes back for cancer when the man does not have it) is 0.51. Some of the following questions do not have enough information for you to answer them. Write “not enough information” for those answers. Let C = a man develops cancer in his lifetime and P = man has at least one false positive.
- P ( C ) = 0.4567
- not enough information
- No, because over half (0.51) of men have at least one false positive text
Given events G and H : P ( G ) = 0.43; P ( H ) = 0.26; P ( H AND G ) = 0.14
- Find P ( H OR G ).
- Find the probability of the complement of event ( H AND G ).
- Find the probability of the complement of event ( H OR G ).
Given events J and K : P ( J ) = 0.18; P ( K ) = 0.37; P ( J OR K ) = 0.45
- Find P ( J AND K ).
- Find the probability of the complement of event ( J AND K ).
- P ( J OR K ) = P ( J ) + P ( K ) − P ( J AND K ); 0.45 = 0.18 + 0.37 – P ( J AND K ); solve to find P ( J AND K ) = 0.10
- P (NOT ( J AND K )) = 1 – P ( J AND K ) = 1 – 0.10 = 0.90
- P (NOT ( J OR K )) = 1 – P ( J OR K ) = 1 – 0.45 = 0.55
Section 3.3
On February 28, 2013, a Field Poll Survey reported that 61% of California registered voters approved of allowing two people of the same gender to marry and have regular marriage laws apply to them. Among 18 to 39 year olds (California registered voters), the approval rating was 78%. Six in ten California registered voters said that the upcoming Supreme Court’s ruling about the constitutionality of California’s Proposition 8 was either very or somewhat important to them. Out of those CA registered voters who support same-sex marriage, 75% say the ruling is important to them.
In this problem, let:
- C = California registered voters who support same-sex marriage.
- B = California registered voters who say the Supreme Court’s ruling about the constitutionality of California’s Proposition 8 is very or somewhat important to them
- A = California registered voters who are 18 to 39 years old.
- Find P ( C ).
- Find P ( B ).
- Find P ( C | A ).
- Find P ( B | C ).
- In words, what is C | A ?
- In words, what is B | C ?
- Find P ( C AND B ).
- In words, what is C AND B ?
- Find P ( C OR B ).
- Are C and B mutually exclusive events? Show why or why not.
After Rob Ford, the mayor of Toronto, announced his plans to cut budget costs in late 2011, the Forum Research polled 1,046 people to measure the mayor’s popularity. Everyone polled expressed either approval or disapproval. These are the results their poll produced:
- In early 2011, 60 percent of the population approved of Mayor Ford’s actions in office.
- In mid-2011, 57 percent of the population approved of his actions.
- In late 2011, the percentage of popular approval was measured at 42 percent.
- What is the sample size for this study?
- What proportion in the poll disapproved of Mayor Ford, according to the results from late 2011?
- How many people polled responded that they approved of Mayor Ford in late 2011?
- What is the probability that a person supported Mayor Ford, based on the data collected in mid-2011?
- What is the probability that a person supported Mayor Ford, based on the data collected in early 2011?
- The Forum Research surveyed 1,046 Torontonians.
- 42% of 1,046 = 439 (rounding to the nearest integer)
Use the following information to answer the next three exercises. The casino game, roulette, allows the gambler to bet on the probability of a ball, which spins in the roulette wheel, landing on a particular color, number, or range of numbers. The table used to place bets contains 38 numbers, and each number is assigned to a color and a range.

- List the sample space of the 38 possible outcomes in roulette.
- You bet on red. Find P (red).
- You bet on -1st 12- (1st Dozen). Find P (-1st 12-).
- You bet on an even number. Find P (even number).
- Is getting an odd number the complement of getting an even number? Why?
- Find two mutually exclusive events.
- Are the events Even and 1st Dozen independent?
Compute the probability of winning the following types of bets:
- Betting on two lines that touch each other on the table as in 1-2-3-4-5-6
- Betting on three numbers in a line, as in 1-2-3
- Betting on one number
- Betting on four numbers that touch each other to form a square, as in 10-11-13-14
- Betting on two numbers that touch each other on the table, as in 10-11 or 10-13
- Betting on 0-00-1-2-3
- Betting on 0-1-2; or 0-00-2; or 00-2-3
- P (Betting on two line that touch each other on the table) = [latex]\frac{6}{38}[/latex]
- P (Betting on three numbers in a line) = [latex]\frac{3}{38}[/latex]
- P (Betting on one number) = [latex]\frac{1}{38}[/latex]
- P (Betting on four number that touch each other to form a square) = [latex]\frac{4}{38}[/latex]
- P (Betting on two number that touch each other on the table) = [latex]\frac{2}{38}[/latex]
- P (Betting on 0-00-1-2-3) = [latex]\frac{5}{38}[/latex]
- P (Betting on 0-1-2; or 0-00-2; or 00-2-3) = [latex]\frac{3}{38}[/latex]
- Betting on a color
- Betting on one of the dozen groups
- Betting on the range of numbers from 1 to 18
- Betting on the range of numbers 19–36
- Betting on one of the columns
- Betting on an even or odd number (excluding zero)
Suppose that you have eight cards. Five are green and three are yellow. The five green cards are numbered 1, 2, 3, 4, and 5. The three yellow cards are numbered 1, 2, and 3. The cards are well shuffled. You randomly draw one card.
- G = card drawn is green
- List the sample space.
- P ( G ) = _____
- P ( G | E ) = _____
- P ( G AND E ) = _____
- P ( G OR E ) = _____
- Are G and E mutually exclusive? Justify your answer numerically.
- { G 1, G 2, G 3, G 4, G 5, Y 1, Y 2, Y 3}
- [latex]\frac{5}{8}\text{}[/latex]
- [latex]\frac{2}{3}\text{}[/latex]
- [latex]\frac{2}{8}\text{}[/latex]
- [latex]\frac{6}{8}\text{}[/latex]
- No, because P ( G AND E ) does not equal 0.
Roll two fair dice. Each die has six faces.
- Let A be the event that either a three or four is rolled first, followed by an even number. Find P ( A ).
- Let B be the event that the sum of the two rolls is at most seven. Find P ( B ).
- In words, explain what “ P ( A | B )” represents. Find P ( A | B ).
- Are A and B mutually exclusive events? Explain your answer in one to three complete sentences, including numerical justification.
- Are A and B independent events? Explain your answer in one to three complete sentences, including numerical justification.
A special deck of cards has ten cards. Four are green, three are blue, and three are red. When a card is picked, its color is recorded. An experiment consists of first picking a card and then tossing a coin.
- Let A be the event that a blue card is picked first, followed by landing a head on the coin toss. Find P ( A ).
- Let B be the event that a red or green is picked, followed by landing a head on the coin toss. Are the events A and B mutually exclusive? Explain your answer in one to three complete sentences, including numerical justification.
- Let C be the event that a red or blue is picked, followed by landing a head on the coin toss. Are the events A and C mutually exclusive? Explain your answer in one to three complete sentences, including numerical justification.
The coin toss is independent of the card picked first.
- {( G , H ) ( G , T ) ( B , H ) ( B , T ) ( R , H ) ( R , T )}
- P ( A ) = P (blue) P (head) = [latex]\left(\frac{3}{10}\right)[/latex][latex]\left(\frac{1}{2}\right)[/latex] = [latex]\frac{3}{20}[/latex]
- Yes, A and B are mutually exclusive because they cannot happen at the same time; you cannot pick a card that is both blue and also (red or green). P ( A AND B ) = 0
- No, A and C are not mutually exclusive because they can occur at the same time. In fact, C includes all of the outcomes of A ; if the card chosen is blue it is also (red or blue). P ( A AND C ) = P ( A ) = [latex]\frac{3}{20}[/latex]
An experiment consists of first rolling a die and then tossing a coin.
- Let A be the event that either a three or a four is rolled first, followed by landing a head on the coin toss. Find P ( A ).
- Let B be the event that the first and second tosses land on heads. Are the events A and B mutually exclusive? Explain your answer in one to three complete sentences, including numerical justification.
An experiment consists of tossing a nickel, a dime, and a quarter. Of interest is the side the coin lands on.
- Let A be the event that there are at least two tails. Find P ( A ).
- Let B be the event that the first and second tosses land on heads. Are the events A and B mutually exclusive? Explain your answer in one to three complete sentences, including justification.
- S = {( HHH ), ( HHT ), ( HTH ), ( HTT ), ( THH ), ( THT ), ( TTH ), ( TTT )}
- [latex]\frac{4}{8}[/latex]
- Yes, because if A has occurred, it is impossible to obtain two tails. In other words, P ( A AND B ) = 0.
Consider the following scenario:
Let P ( C ) = 0.4.
Let P ( D ) = 0.5.
Let P ( C | D ) = 0.6.
Y and Z are independent events.
- Rewrite the basic Addition Rule P ( Y OR Z ) = P ( Y ) + P ( Z ) – P ( Y AND Z ) using the information that Y and Z are independent events.
- Use the rewritten rule to find P ( Z ) if P ( Y OR Z ) = 0.71 and P ( Y ) = 0.42.
- If Y and Z are independent, then P ( Y AND Z ) = P ( Y ) P ( Z ), so P ( Y OR Z ) = P ( Y ) + P ( Z ) – P ( Y ) P ( Z ).
G and H are mutually exclusive events. P ( G ) = 0.5 P ( H ) = 0.3
- Explain why the following statement MUST be false: P ( H | G ) = 0.4.
- Are G and H independent or dependent events? Explain in a complete sentence.
Approximately 281,000,000 people over age five live in the United States. Of these people, 55,000,000 speak a language other than English at home. Of those who speak another language at home, 62.3% speak Spanish.
Let: E = speaks English at home; E′ = speaks another language at home; S = speaks Spanish;
Finish each probability statement by matching the correct answer.
| Probability Statements | Answers |
|---|---|
| a. ( ) = | i. 0.8043 |
| b. ( ) = | ii. 0.623 |
| c. ( and ) = | iii. 0.1957 |
| d. ( | ) = | iv. 0.1219 |
iii i iv ii
1994, the U.S. government held a lottery to issue 55,000 Green Cards (permits for non-citizens to work legally in the U.S.). Renate Deutsch, from Germany, was one of approximately 6.5 million people who entered this lottery. Let G = won green card.
- What was Renate’s chance of winning a Green Card? Write your answer as a probability statement.
- In the summer of 1994, Renate received a letter stating she was one of 110,000 finalists chosen. Once the finalists were chosen, assuming that each finalist had an equal chance to win, what was Renate’s chance of winning a Green Card? Write your answer as a conditional probability statement. Let F = was a finalist.
- Are G and F independent or dependent events? Justify your answer numerically and also explain why.
- Are G and F mutually exclusive events? Justify your answer numerically and explain why.
Three professors at George Washington University did an experiment to determine if economists are more selfish than other people. They dropped 64 stamped, addressed envelopes with 💲10 cash in different classrooms on the George Washington campus. 44% were returned overall. From the economics classes 56% of the envelopes were returned. From the business, psychology, and history classes 31% were returned.
Let: R = money returned; E = economics classes; O = other classes
- Write a probability statement for the overall percent of money returned.
- Write a probability statement for the percent of money returned out of the economics classes.
- Write a probability statement for the percent of money returned out of the other classes.
- Is money being returned independent of the class? Justify your answer numerically and explain it.
- Based upon this study, do you think that economists are more selfish than other people? Explain why or why not. Include numbers to justify your answer.
- P ( R ) = 0.44
- P ( R | E ) = 0.56
- P ( R | O ) = 0.31
- No, whether the money is returned is not independent of which class the money was placed in. There are several ways to justify this mathematically, but one is that the money placed in economics classes is not returned at the same overall rate; P ( R | E ) ≠ P ( R ).
- No, this study definitely does not support that notion; in fact , it suggests the opposite. The money placed in the economics classrooms was returned at a higher rate than the money place in all classes collectively; P ( R | E ) > P ( R ).
The following table of data obtained from www.baseball-almanac.com shows hit information for four players. Suppose that one hit from the table is randomly selected.
| Name | Single | Double | Triple | Home Run | Total Hits |
|---|---|---|---|---|---|
| Babe Ruth | 1,517 | 506 | 136 | 714 | 2,873 |
| Jackie Robinson | 1,054 | 273 | 54 | 137 | 1,518 |
| Ty Cobb | 3,603 | 174 | 295 | 114 | 4,189 |
| Hank Aaron | 2,294 | 624 | 98 | 755 | 3,771 |
| Total | 8,471 | 1,577 | 583 | 1,720 | 12,351 |
Are “the hit being made by Hank Aaron” and “the hit being a double” independent events?
- Yes, because P (hit by Hank Aaron|hit is a double) = P (hit by Hank Aaron)
- No, because P (hit by Hank Aaron|hit is a double) ≠ P (hit is a double)
- No, because P (hit is by Hank Aaron|hit is a double) ≠ P (hit by Hank Aaron)
- Yes, because P (hit is by Hank Aaron|hit is a double) = P (hit is a double)
United Blood Services is a blood bank that serves more than 500 hospitals in 18 states. According to their website, a person with type O blood and a negative Rh factor (Rh-) can donate blood to any person with any blood type. Their data show that 43% of people have type O blood and 15% of people have Rh- factor; 52% of people have type O or Rh- factor.
- Find the probability that a person has both type O blood and the Rh- factor.
- Find the probability that a person does NOT have both type O blood and the Rh- factor.
P (type O OR Rh-) = P (type O) + P (Rh-) – P (type O AND Rh-)
0.52 = 0.43 + 0.15 – P (type O AND Rh-); solve to find P (type O AND Rh-) = 0.06
6% of people have type O, Rh- blood
P (NOT(type O AND Rh-)) = 1 – P (type O AND Rh-) = 1 – 0.06 = 0.94
94% of people do not have type O, Rh- blood
At a college, 72% of courses have final exams and 46% of courses require research papers. Suppose that 32% of courses have a research paper and a final exam. Let F be the event that a course has a final exam. Let R be the event that a course requires a research paper.
- Find the probability that a course has a final exam or a research project.
- Find the probability that a course has NEITHER of these two requirements.
In a box of assorted cookies, 36% contain chocolate and 12% contain nuts. Of those, 8% contain both chocolate and nuts. Sean is allergic to both chocolate and nuts.
- Find the probability that a cookie contains chocolate or nuts (he can’t eat it).
- Find the probability that a cookie does not contain chocolate or nuts (he can eat it).
- Let C = be the event that the cookie contains chocolate. Let N = the event that the cookie contains nuts.
- P ( C OR N ) = P ( C ) + P ( N ) – P ( C AND N ) = 0.36 + 0.12 – 0.08 = 0.40
- P (NEITHER chocolate NOR nuts) = 1 – P ( C OR N ) = 1 – 0.40 = 0.60
A college finds that 10% of students have taken a distance learning class and that 40% of students are part time students. Of the part time students, 20% have taken a distance learning class. Let D = event that a student takes a distance learning class and E = event that a student is a part time student
- Find P ( D AND E ).
- Find P ( E | D ).
- Find P ( D OR E ).
- Using an appropriate test, show whether D and E are independent.
- Using an appropriate test, show whether D and E are mutually exclusive.
Section 3.4
Use the information in the [link] to answer the next eight exercises. The table shows the political party affiliation of each of 67 members of the US Senate in June 2012, and when they are up for reelection.
| Up for reelection: | Democratic Party | Republican Party | Other | Total |
|---|---|---|---|---|
| November 2014 | 20 | 13 | 0 | |
| November 2016 | 10 | 24 | 0 | |
| Total |
What is the probability that a randomly selected senator has an “Other” affiliation?
What is the probability that a randomly selected senator is up for reelection in November 2016?
What is the probability that a randomly selected senator is a Democrat and up for reelection in November 2016?
[latex]\frac{10}{67}[/latex]
What is the probability that a randomly selected senator is a Republican or is up for reelection in November 2014?
Suppose that a member of the US Senate is randomly selected. Given that the randomly selected senator is up for reelection in November 2016, what is the probability that this senator is a Democrat?
[latex]\frac{10}{34}[/latex]
Suppose that a member of the US Senate is randomly selected. What is the probability that the senator is up for reelection in November 2014, knowing that this senator is a Republican?
The events “Republican” and “Up for reelection in 2016” are ________
- mutually exclusive.
- independent.
- both mutually exclusive and independent.
- neither mutually exclusive nor independent.
The events “Other” and “Up for reelection in November 2016” are ________
[link] gives the number of suicides estimated in the U.S. for a recent year by age, race (black or white), and sex. We are interested in possible relationships between age, race, and sex. We will let suicide victims be our population.
| Race and Sex | 1–14 | 15–24 | 25–64 | over 64 | TOTALS |
|---|---|---|---|---|---|
| white, male | 210 | 3,360 | 13,610 | 22,050 | |
| white, female | 80 | 580 | 3,380 | 4,930 | |
| black, male | 10 | 460 | 1,060 | 1,670 | |
| black, female | 0 | 40 | 270 | 330 | |
| all others | |||||
| TOTALS | 310 | 4,650 | 18,780 | 29,760 |
Do not include “all others” for parts f and g.
| Race and Sex | 1–14 | 15–24 | 25–64 | over 64 | TOTALS |
|---|---|---|---|---|---|
| white, male | 210 | 3,360 | 13,610 | 4,870 | 22,050 |
| white, female | 80 | 580 | 3,380 | 890 | 4,930 |
| black, male | 10 | 460 | 1,060 | 140 | 1,670 |
| black, female | 0 | 40 | 270 | 20 | 330 |
| all others | 100 | ||||
| TOTALS | 310 | 4,650 | 18,780 | 6,020 | 29,760 |
| Race and Sex | 1–14 | 15–24 | 25–64 | over 64 | TOTALS |
|---|---|---|---|---|---|
| white, male | 210 | 3,360 | 13,610 | 4,870 | 22,050 |
| white, female | 80 | 580 | 3,380 | 890 | 4,930 |
| black, male | 10 | 460 | 1,060 | 140 | 1,670 |
| black, female | 0 | 40 | 270 | 20 | 330 |
| all others | 10 | 210 | 460 | 100 | 780 |
| TOTALS | 310 | 4,650 | 18,780 | 6,020 | 29,760 |
- [latex]\frac{\text{22,050}}{\text{29,760}}[/latex]
- [latex]\frac{\text{330}}{\text{29,760}}[/latex]
- [latex]\frac{\text{2,000}}{\text{29,760}}[/latex]
- [latex]\frac{\text{23,720}}{\text{29,760}}[/latex]
- [latex]\frac{\text{5,010}}{\text{6,020}}[/latex]
Use the following information to answer the next two exercises. The table of data obtained from www.baseball-almanac.com shows hit information for four well known baseball players. Suppose that one hit from the table is randomly selected.
| NAME | Single | Double | Triple | Home Run | TOTAL HITS |
|---|---|---|---|---|---|
| Babe Ruth | 1,517 | 506 | 136 | 714 | 2,873 |
| Jackie Robinson | 1,054 | 273 | 54 | 137 | 1,518 |
| Ty Cobb | 3,603 | 174 | 295 | 114 | 4,189 |
| Hank Aaron | 2,294 | 624 | 98 | 755 | 3,771 |
| TOTAL | 8,471 | 1,577 | 583 | 1,720 | 12,351 |
Find P (hit was made by Babe Ruth).
- [latex]\frac{1518}{2873}[/latex]
- [latex]\frac{2873}{12351}[/latex]
- [latex]\frac{583}{12351}[/latex]
- [latex]\frac{4189}{12351}[/latex]
Find P (hit was made by Ty Cobb|The hit was a Home Run).
- [latex]\frac{114}{1720}[/latex]
- [latex]\frac{1720}{4189}[/latex]
- [latex]\frac{114}{12351}[/latex]
[link] identifies a group of children by one of four hair colors, and by type of hair.
| Hair Type | Brown | Blond | Black | Red | Totals |
|---|---|---|---|---|---|
| Wavy | 20 | 15 | 3 | 43 | |
| Straight | 80 | 15 | 12 | ||
| Totals | 20 | 215 |
- Complete the table.
- What is the probability that a randomly selected child will have wavy hair?
- What is the probability that a randomly selected child will have either brown or blond hair?
- What is the probability that a randomly selected child will have wavy brown hair?
- What is the probability that a randomly selected child will have red hair, given that he or she has straight hair?
- If B is the event of a child having brown hair, find the probability of the complement of B .
- In words, what does the complement of B represent?
In a previous year, the weights of the members of the San Francisco 49ers and the Dallas Cowboys were published in the San Jose Mercury News . The factual data were compiled into the following table.
| Shirt# | ≤ 210 | 211–250 | 251–290 | > 290 |
|---|---|---|---|---|
| 1–33 | 21 | 5 | 0 | 0 |
| 34–66 | 6 | 18 | 7 | 4 |
| 66–99 | 6 | 12 | 22 | 5 |
- [latex]\frac{26}{106}[/latex]
- [latex]\frac{33}{106}[/latex]
- [latex]\frac{21}{106}[/latex]
- [latex]\left(\frac{26}{106}\right)[/latex] + [latex]\left(\frac{33}{106}\right)[/latex] – [latex]\left(\frac{21}{106}\right)[/latex] = [latex]\left(\frac{38}{106}\right)[/latex]
- [latex]\frac{21}{33}[/latex]
Use the following information to answer the next seven exercises. An article in the New England Journal of Medicine , reported about a study of smokers in California and Hawaii. In one part of the report, the self-reported ethnicity and smoking levels per day were given. Of the people smoking at most ten cigarettes per day, there were 9,886 African Americans, 2,745 Native Hawaiians, 12,831 Latinos, 8,378 Japanese Americans, and 7,650 Whites. Of the people smoking 11 to 20 cigarettes per day, there were 6,514 African Americans, 3,062 Native Hawaiians, 4,932 Latinos, 10,680 Japanese Americans, and 9,877 Whites. Of the people smoking 21 to 30 cigarettes per day, there were 1,671 African Americans, 1,419 Native Hawaiians, 1,406 Latinos, 4,715 Japanese Americans, and 6,062 Whites. Of the people smoking at least 31 cigarettes per day, there were 759 African Americans, 788 Native Hawaiians, 800 Latinos, 2,305 Japanese Americans, and 3,970 Whites.
Complete the table using the data provided. Suppose that one person from the study is randomly selected. Find the probability that person smoked 11 to 20 cigarettes per day.
| Smoking Level | African American | Native Hawaiian | Latino | Japanese Americans | White | TOTALS |
|---|---|---|---|---|---|---|
| 1–10 | ||||||
| 11–20 | ||||||
| 21–30 | ||||||
| 31+ | ||||||
| TOTALS |
Suppose that one person from the study is randomly selected. Find the probability that person smoked 11 to 20 cigarettes per day.
[latex]\frac{35,065}{100,450}[/latex]
Find the probability that the person was Latino.
In words, explain what it means to pick one person from the study who is “Japanese American AND smokes 21 to 30 cigarettes per day.” Also, find the probability.
To pick one person from the study who is Japanese American AND smokes 21 to 30 cigarettes per day means that the person has to meet both criteria: both Japanese American and smokes 21 to 30 cigarettes. The sample space should include everyone in the study. The probability is [latex]\frac{4,715}{100,450}[/latex].
In words, explain what it means to pick one person from the study who is “Japanese American OR smokes 21 to 30 cigarettes per day.” Also, find the probability.
In words, explain what it means to pick one person from the study who is “Japanese American GIVEN that person smokes 21 to 30 cigarettes per day.” Also, find the probability.
To pick one person from the study who is Japanese American given that person smokes 21-30 cigarettes per day, means that the person must fulfill both criteria and the sample space is reduced to those who smoke 21-30 cigarettes per day. The probability is [latex]\frac{4715}{15,273}[/latex].
Prove that smoking level/day and ethnicity are dependent events.
Use the following information to answer the next two exercises. This tree diagram shows the tossing of an unfair coin followed by drawing one bead from a cup containing three red ( R ), four yellow ( Y ) and five blue ( B ) beads. For the coin, P ( H ) = [latex]\frac{2}{3}[/latex] and P ( T ) = [latex]\frac{1}{3}[/latex] where H is heads and T is tails.

Find P (tossing a Head on the coin AND a Red bead)
- [latex]\frac{2}{3}[/latex]
- [latex]\frac{5}{15}[/latex]
- [latex]\frac{6}{36}[/latex]
- [latex]\frac{5}{36}[/latex]
Find P (Blue bead).
- [latex]\frac{15}{36}[/latex]
- [latex]\frac{10}{36}[/latex]
- [latex]\frac{10}{12}[/latex]
A box of cookies contains three chocolate and seven butter cookies. Miguel randomly selects a cookie and eats it. Then he randomly selects another cookie and eats it. (How many cookies did he take?)
- Draw the tree that represents the possibilities for the cookie selections. Write the probabilities along each branch of the tree.
- Are the probabilities for the flavor of the SECOND cookie that Miguel selects independent of his first selection? Explain.
- For each complete path through the tree, write the event it represents and find the probabilities.
- Let S be the event that both cookies selected were the same flavor. Find P ( S ).
- Let T be the event that the cookies selected were different flavors. Find P ( T ) by two different methods: by using the complement rule and by using the branches of the tree. Your answers should be the same with both methods.
- Let U be the event that the second cookie selected is a butter cookie. Find P ( U ).
Use the following information to answer the next two exercises. Suppose that you have eight cards. Five are green and three are yellow. The cards are well shuffled.
Suppose that you randomly draw two cards, one at a time, with replacement .
Let G 1 = first card is green
Let G 2 = second card is green
- Draw a tree diagram of the situation.
- Find P ( G 1 AND G 2 ).
- Find P (at least one green).
- Find P ( G 2 | G 1 ).
- Are G 2 and G 1 independent events? Explain why or why not.

- P ( GG ) = [latex]\left(\frac{5}{8}\right)\left(\frac{5}{8}\right)[/latex] = [latex]\frac{25}{64}[/latex]
- P (at least one green) = P ( GG ) + P ( GY ) + P ( YG ) = [latex]\frac{25}{64}[/latex] + [latex]\frac{15}{64}[/latex] + [latex]\frac{15}{64}[/latex] = [latex]\frac{55}{64}[/latex]
- P ( G | G ) = [latex]\frac{5}{8}[/latex]
- Yes, they are independent because the first card is placed back in the bag before the second card is drawn; the composition of cards in the bag remains the same from draw one to draw two.
Suppose that you randomly draw two cards, one at a time, without replacement .
G 1 = first card is green
G 2 = second card is green
Use the following information to answer the next two exercises. The percent of licensed U.S. drivers (from a recent year) that are female is 48.60. Of the females, 5.03% are age 19 and under; 81.36% are age 20–64; 13.61% are age 65 or over. Of the licensed U.S. male drivers, 5.04% are age 19 and under; 81.43% are age 20–64; 13.53% are age 65 or over.
Complete the following.
- Construct a table or a tree diagram of the situation.
- Find P (driver is female).
- Find P (driver is age 65 or over|driver is female).
- Find P (driver is age 65 or over AND female).
- In words, explain the difference between the probabilities in part c and part d.
- Find P (driver is age 65 or over).
- Are being age 65 or over and being female mutually exclusive events? How do you know?
| <20 | 20–64 | >64 | Totals | |
|---|---|---|---|---|
| 0.0244 | 0.3954 | 0.0661 | 0.486 | |
| 0.0259 | 0.4186 | 0.0695 | 0.514 | |
| 0.0503 | 0.8140 | 0.1356 | 1 |
- P ( F ) = 0.486
- P (>64| F ) = 0.1361
- P (>64 and F ) = P ( F ) P (>64| F ) = (0.486)(0.1361) = 0.0661
- P (>64| F ) is the percentage of female drivers who are 65 or older and P (>64 and F ) is the percentage of drivers who are female and 65 or older.
- P (> 64 ) = P (>64 and F ) + P (>64 and M ) = 0.1356
- No, being female and 65 or older are not mutually exclusive because they can occur at the same time P(>64 and F ) = 0.0661.
Suppose that 10,000 U.S. licensed drivers are randomly selected.
- How many would you expect to be male?
- Using the table or tree diagram, construct a contingency table of gender versus age group.
- Using the contingency table, find the probability that out of the age 20–64 group, a randomly selected driver is female.
Approximately 86.5% of Americans commute to work by car, truck, or van. Out of that group, 84.6% drive alone and 15.4% drive in a carpool. Approximately 3.9% walk to work and approximately 5.3% take public transportation.
- Construct a table or a tree diagram of the situation. Include a branch for all other modes of transportation to work.
- Assuming that the walkers walk alone, what percent of all commuters travel alone to work?
- Suppose that 1,000 workers are randomly selected. How many would you expect to travel alone to work?
- Suppose that 1,000 workers are randomly selected. How many would you expect to drive in a carpool?
| Car, Truck or Van | Walk | Public Transportation | Other | Totals | |
|---|---|---|---|---|---|
| 0.7318 | |||||
| 0.1332 | |||||
| 0.8650 | 0.0390 | 0.0530 | 0.0430 | 1 |
- If we assume that all walkers are alone and that none from the other two groups travel alone (which is a big assumption) we have: P (Alone) = 0.7318 + 0.0390 = 0.7708.
- Make the same assumptions as in (b) we have: (0.7708)(1,000) = 771
- (0.1332)(1,000) = 133
When the Euro coin was introduced in 2002, two math professors had their statistics students test whether the Belgian one Euro coin was a fair coin. They spun the coin rather than tossing it and found that out of 250 spins, 140 showed a head (event H ) while 110 showed a tail (event T ). On that basis, they claimed that it is not a fair coin.
- Based on the given data, find P ( H ) and P ( T ).
- Use a tree to find the probabilities of each possible outcome for the experiment of tossing the coin twice.
- Use the tree to find the probability of obtaining exactly one head in two tosses of the coin.
- Use the tree to find the probability of obtaining at least one head.
Use the following information to answer the next two exercises. The following are real data from Santa Clara County, CA. As of a certain time, there had been a total of 3,059 documented cases of AIDS in the county. They were grouped into the following categories:
| Homosexual/Bisexual | IV Drug User* | Heterosexual Contact | Other | Totals | |
|---|---|---|---|---|---|
| Female | 0 | 70 | 136 | 49 | ____ |
| Male | 2,146 | 463 | 60 | 135 | ____ |
| Totals | ____ | ____ | ____ | ____ | ____ |
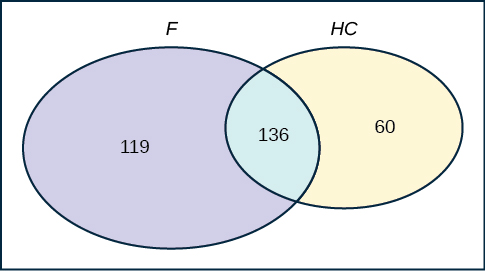
Suppose a person with AIDS in Santa Clara County is randomly selected.
- Find P (Person is female).
- Find P (Person has a risk factor heterosexual contact).
- Find P (Person is female OR has a risk factor of IV drug user).
- Find P (Person is female AND has a risk factor of homosexual/bisexual).
- Find P (Person is male AND has a risk factor of IV drug user).
- Find P (Person is female GIVEN person got the disease from heterosexual contact).
- Construct a Venn diagram. Make one group females and the other group heterosexual contact.
The completed contingency table is as follows:
| Homosexual/Bisexual | IV Drug User* | Heterosexual Contact | Other | Totals | |
|---|---|---|---|---|---|
| Female | 0 | 70 | 136 | 49 | |
| Male | 2,146 | 463 | 60 | 135 | |
| Totals |
- [latex]\frac{255}{3059}[/latex]
- [latex]\frac{196}{3059}[/latex]
- [latex]\frac{718}{3059}[/latex]
- [latex]\frac{463}{3059}[/latex]
- [latex]\frac{136}{196}[/latex]
Answer these questions using probability rules. Do NOT use the contingency table. Three thousand fifty-nine cases of AIDS had been reported in Santa Clara County, CA, through a certain date. Those cases will be our population. Of those cases, 6.4% obtained the disease through heterosexual contact and 7.4% are female. Out of the females with the disease, 53.3% got the disease from heterosexual contact.
- Find P (Person obtained the disease through heterosexual contact).
- Find P (Person is female GIVEN person got the disease from heterosexual contact)
- Construct a Venn diagram representing this situation. Make one group females and the other group heterosexual contact. Fill in all values as probabilities.
Introductory Statistics Copyright © 2024 by LOUIS: The Louisiana Library Network is licensed under a Creative Commons Attribution-ShareAlike 4.0 International License , except where otherwise noted.
Share This Book
| Stem | Leaf |
|---|---|
| 1 | 9 9 9 |
| 2 | 0 1 1 5 5 5 6 6 8 9 |
| 3 | 1 1 2 2 3 4 5 6 7 7 8 8 8 8 |
| 4 | 1 3 3 |
| Stem | Leaf |
|---|---|
| 2 | 5 5 6 7 7 8 |
| 3 | 0 0 1 2 3 3 5 5 5 7 7 9 |
| 4 | 1 6 9 |
| 5 | 6 7 7 |
| 6 | 1 |
The relative frequency shows the proportion of data points that have each value. The frequency tells the number of data points that have each value.
Answers will vary. One possible histogram is shown below.
Find the midpoint for each class. These will be graphed on the x -axis. The frequency values will be graphed on the y -axis values.
- The 40 th percentile is 37 years.
- The 78 th percentile is 70 years.
Jesse graduated 37 th out of a class of 180 students. There are 180 – 37 = 143 students ranked below Jesse. There is one rank of 37.
x = 143 and y = 1. x + .5 y n x + .5 y n (100) = 143 + .5 ( 1 ) 180 143 + .5 ( 1 ) 180 (100) = 79.72. Jesse’s rank of 37 puts him at the 80 th percentile.
- For runners in a race, it is more desirable to have a high percentile for speed. A high percentile means a higher speed, which is faster.
- 40 percent of runners ran at speeds of 7.5 miles per hour or less (slower), and 60 percent of runners ran at speeds of 7.5 miles per hour or more (faster).
When waiting in line at the DMV, the 85 th percentile would be a long wait time compared to the other people waiting. 85 percent of people had shorter wait times than Mina. In this context, Mina would prefer a wait time corresponding to a lower percentile. 85 percent of people at the DMV waited 32 minutes or less. 15 percent of people at the DMV waited 32 minutes or longer.
The manufacturer and the consumer would be upset. This is a large repair cost for the damages, compared to the other cars in the sample. INTERPRETATION: 90 percent of the crash-tested cars had damage repair costs of $1,700 or less; only 10 percent had damage repair costs of $1,700 or more.
You can afford 34 percent of houses. 66 percent of the houses are too expensive for your budget. INTERPRETATION: 34 percent of houses cost $240,000 or less; 66 percent of houses cost $240,000 or more.
More than 25 percent of salespersons sell four cars in a typical week. You can see this concentration in the box plot because the first quartile is equal to the median. The top 25 percent and the bottom 25 percent are spread out evenly; the whiskers have the same length.
Mean: 16 + 17 + 19 + 20 + 20 + 21 + 23 + 24 + 25 + 25 + 25 + 26 + 26 + 27 + 27 + 27 + 28 + 29 + 30 + 32 + 33 + 33 + 34 + 35 + 37 + 39 + 40 = 738;
738 27 738 27 = 27.33
The most frequent lengths are 25 and 27, which occur three times. Mode = 25, 27
The data are symmetrical. The median is 3, and the mean is 2.85. They are close, and the mode lies close to the middle of the data, so the data are symmetrical.
The data are skewed right. The median is 87.5, and the mean is 88.2. Even though they are close, the mode lies to the left of the middle of the data, and there are many more instances of 87 than any other number, so the data are skewed right.
When the data are symmetrical, the mean and median are close or the same.
The distribution is skewed right because it looks pulled out to the right.
The mean is 4.1 and is slightly greater than the median, which is 4.
The mode and the median are the same. In this case, both 5.
The distribution is skewed left because it looks pulled out to the left.
Both the mean and the median are 6.
The mode is 12, the median is 13.5, and the mean is 15.1. The mean is the largest.
The mean tends to reflect skewing the most because it is affected the most by outliers.
sampling variability
induced variability
measurement variability
natural variability
For Fredo: z = .158 – .166 .012 .158 – .166 .012 = –0.67.
For Karl: z = .177 – .189 .015 .177 – .189 .015 = –.8.
Fredo’s z score of –.67 is higher than Karl’s z score of –.8. For batting average, higher values are better, so Fredo has a better batting average compared to his team.
- s x = ∑ f m 2 n − x ¯ 2 = 193,157.45 30 − 79.5 2 = 10.88 s x = ∑ f m 2 n − x ¯ 2 = 193,157.45 30 − 79.5 2 = 10.88
- s x = ∑ f m 2 n − x ¯ 2 = 380,945.3 101 − 60.94 2 = 7.62 s x = ∑ f m 2 n − x ¯ 2 = 380,945.3 101 − 60.94 2 = 7.62
- s x = ∑ f m 2 n − x ¯ 2 = 440,051.5 86 − 70.66 2 = 11.14 s x = ∑ f m 2 n − x ¯ 2 = 440,051.5 86 − 70.66 2 = 11.14
- Number the entries in the table 1–51 (includes Washington, DC; numbered vertically)
- Arrow over to PRB
- Press 5:randInt(
- Enter 51,1,8)
Eight numbers are generated (use the right arrow key to scroll through the numbers). The numbers correspond to the numbered states (for this example: {47 21 9 23 51 13 25 4}. If any numbers are repeated, generate a different number by using 5:randInt(51,1)). Here, the states (and Washington DC) are {Arkansas, Washington DC, Idaho, Maryland, Michigan, Mississippi, Virginia, Wyoming}.
Corresponding percents are {30.1, 22.2, 26.5, 27.1, 30.9, 34.0, 26.0, 25.1}.
| Amount($) | Frequency | Relative Frequency |
|---|---|---|
| 51–100 | 5 | .08 |
| 101–150 | 10 | .17 |
| 151–200 | 15 | .25 |
| 201–250 | 15 | .25 |
| 251–300 | 10 | .17 |
| 301–350 | 5 | .08 |
| Amount ($) | Frequency | Relative Frequency |
|---|---|---|
| 100–150 | 5 | .07 |
| 201–250 | 5 | .07 |
| 251–300 | 5 | .07 |
| 301–350 | 5 | .07 |
| 351–400 | 10 | .14 |
| 401–450 | 10 | .14 |
| 451–500 | 10 | .14 |
| 501–550 | 10 | .14 |
| 551–600 | 5 | .07 |
| 601–650 | 5 | .07 |
- See Table 2.89 and Table 2.90 .
- Both graphs have a single peak.
- Both graphs use class intervals with width equal to $50
- The couples graph has a class interval with no values
- It takes almost twice as many class intervals to display the data for couples
- Answers may vary. Possible answers include the following. The graphs are more similar than different because the overall patterns for the graphs are the same.
- Check student's solution.
- Both graphs have a single peak
- Both graphs display six class intervals
- Both graphs show the same general pattern
- Answers may vary. Possible answers include the following. Although the width of the class intervals for couples is double that of the class intervals for singles, the graphs are more similar than they are different.
- Answers may vary. Possible answers include the following. You are able to compare the graphs interval by interval. It is easier to compare the overall patterns with the new scale on the couples graph. Because a couple represents two individuals, the new scale leads to a more accurate comparison.
- Answers may vary. Possible answers include the following. Based on the histograms, it seems that spending does not vary much from singles to individuals who are part of a couple. The overall patterns are the same. The range of spending for couples is approximately double the range for individuals.
Answers will vary.
- 1 – (.02+.09+.19+.26+.18+.17+.02+.01) = .06
- .19+.26+.18 = .63
- Check student’s solution.
40 th percentile will fall between 30,000 and 40,000
80 th percentile will fall between 50,000 and 75,000
- more children; the left whisker shows that 25 percent of the population are children 17 and younger; the right whisker shows that 25 percent of the population are adults 50 and older, so adults 65 and over represent less than 25 percent
- 62.4 percent
- Answers will vary. Possible answer: State University conducted a survey to see how involved its students are in community service. The box plot shows the number of community service hours logged by participants over the past year.
- Because the first and second quartiles are close, the data in this quarter is very similar. There is not much variation in the values. The data in the third quarter is much more variable, or spread out. This is clear because the second quartile is so far away from the third quartile.
- Each box plot is spread out more in the greater values. Each plot is skewed to the right, so the ages of the top 50 percent of buyers are more variable than the ages of the lower 50 percent.
- The black sports car is most likely to have an outlier. It has the longest whisker.
- Comparing the median ages, younger people tend to buy the black sports car, while older people tend to buy the white sports car. However, this is not a rule, because there is so much variability in each data set.
- The second quarter has the smallest spread. There seems to be only a three-year difference between the first quartile and the median.
- The third quarter has the largest spread. There seems to be approximately a 14-year difference between the median and the third quartile.
- IQR ~ 17 years
- There is not enough information to tell. Each interval lies within a quarter, so we cannot tell exactly where the data in that quarter is are concentrated.
- The interval from 31 to 35 years has the fewest data values. Twenty-five percent of the values fall in the interval 38 to 41, and 25 percent fall between 41 and 64. Since 25 percent of values fall between 31 and 38, we know that fewer than 25 percent fall between 31 and 35.
the mean percentage, x ¯ = 1,328.65 50 = 26.75 x ¯ = 1,328.65 50 = 26.75
The median value is the middle value in the ordered list of data values. The median value of a set of 11 will be the sixth number in order. Six years will have totals at or below the median.
- mean = 1,809.3
- median = 1,812.5
- standard deviation = 151.2
- first quartile = 1,690
- third quartile = 1,935
Hint: think about the number of years covered by each time period and what happened to higher education during those periods.
For pianos, the cost of the piano is .4 standard deviations BELOW the mean. For guitars, the cost of the guitar is 0.25 standard deviations ABOVE the mean. For drums, the cost of the drum set is 1.0 standard deviations BELOW the mean. Of the three, the drums cost the lowest in comparison to the cost of other instruments of the same type. The guitar costs the most in comparison to the cost of other instruments of the same type.
- x ¯ = 23.32 x ¯ = 23.32
- Using the TI 83/84, we obtain a standard deviation of: s x = 12.95. s x = 12.95.
- The obesity rate of the United States is 10.58 percent higher than the average obesity rate.
- Since the standard deviation is 12.95, we see that 23.32 + 12.95 = 36.27 is the disease percentage that is one standard deviation from the mean. The U.S. disease rate is slightly less than one standard deviation from the mean. Therefore, we can assume that the United States, although 34 percent have the disease, does not have an unusually high percentage of people with the disease.
- For graph, check student's solution.
- 49.7 percent of the community is under the age of 35
- Based on the information in the table, graph (a) most closely represents the data.
- 174, 177, 178, 184, 185, 185, 185, 185, 188, 190, 200, 205, 205, 206, 210, 210, 210, 212, 212, 215, 215, 220, 223, 228, 230, 232, 241, 241, 242, 245, 247, 250, 250, 259, 260, 260, 265, 265, 270, 272, 273, 275, 276, 278, 280, 280, 285, 285, 286, 290, 290, 295, 302
- 205.5, 272.5
- .84 standard deviations below the mean
| Enrollment | Frequency |
|---|---|
| 1,000–5,000 | 10 |
| 5,000–10,000 | 16 |
| 10,000–15,000 | 3 |
| 15,000–20,000 | 3 |
| 20,000–25,000 | 1 |
| 25,000–30,000 | 2 |
This book may not be used in the training of large language models or otherwise be ingested into large language models or generative AI offerings without OpenStax's permission.
Want to cite, share, or modify this book? This book uses the Creative Commons Attribution License and you must attribute Texas Education Agency (TEA). The original material is available at: https://www.texasgateway.org/book/tea-statistics . Changes were made to the original material, including updates to art, structure, and other content updates.
Access for free at https://openstax.org/books/statistics/pages/1-introduction
- Authors: Barbara Illowsky, Susan Dean
- Publisher/website: OpenStax
- Book title: Statistics
- Publication date: Mar 27, 2020
- Location: Houston, Texas
- Book URL: https://openstax.org/books/statistics/pages/1-introduction
- Section URL: https://openstax.org/books/statistics/pages/2-solutions
© Apr 16, 2024 Texas Education Agency (TEA). The OpenStax name, OpenStax logo, OpenStax book covers, OpenStax CNX name, and OpenStax CNX logo are not subject to the Creative Commons license and may not be reproduced without the prior and express written consent of Rice University.
If you're seeing this message, it means we're having trouble loading external resources on our website.
If you're behind a web filter, please make sure that the domains *.kastatic.org and *.kasandbox.org are unblocked.
To log in and use all the features of Khan Academy, please enable JavaScript in your browser.
Statistics and probability
Unit 1: analyzing categorical data, unit 2: displaying and comparing quantitative data, unit 3: summarizing quantitative data, unit 4: modeling data distributions, unit 5: exploring bivariate numerical data, unit 6: study design, unit 7: probability, unit 8: counting, permutations, and combinations, unit 9: random variables, unit 10: sampling distributions, unit 11: confidence intervals, unit 12: significance tests (hypothesis testing), unit 13: two-sample inference for the difference between groups, unit 14: inference for categorical data (chi-square tests), unit 15: advanced regression (inference and transforming), unit 16: analysis of variance (anova).
IMAGES
COMMENTS
Learn statistics with MyMathLab flashcards, games, and more on Quizlet for free.
Study with Quizlet and memorize flashcards containing terms like What does it mean if a statistic is resistant?, The U.S. Department of Housing and Urban Development (HUD) uses the median to report the average price of a home in the United States. Why do you think HUD uses the median?, A histogram of a set of data indicates that the distribution of the data is skewed right. Which measure of ...
MyLab Statistics Homework Math 1240 Learn with flashcards, games, and more — for free.
This free textbook is an OpenStax resource written to increase student access to high-quality, peer-reviewed learning materials.
Test your knowledge of statistics with this homework chapter based on interviews, graphs, and exercises. OpenStax offers free online textbooks and resources.
Now, with expert-verified solutions from Elementary Statistics 13th Edition, you'll learn how to solve your toughest homework problems. Our resource for Elementary Statistics includes answers to chapter exercises, as well as detailed information to walk you through the process step by step.
Section 3.2 Use the following information to answer the next 12 exercises. The graph shown is based on more than 170,000 interviews done by Gallup that took place from January through December 2012. The sample consists of employed Americans 18 years of age or older. The Emotional Health Index Scores are the sample space.
Now, with expert-verified solutions from Statistics 4th Edition, you'll learn how to solve your toughest homework problems. Our resource for Statistics includes answers to chapter exercises, as well as detailed information to walk you through the process step by step.
In this module we learned the basic terminology of probability. The set of all possible outcomes of an experiment is called the sample space. Events are...
Access Elementary Statistics 13th Edition Chapter 3.1 solutions now. Our solutions are written by Chegg experts so you can be assured of the highest quality!
This free textbook is an OpenStax resource written to increase student access to high-quality, peer-reviewed learning materials.
Now, with expert-verified solutions from Introductory Statistics 1st Edition, you'll learn how to solve your toughest homework problems. Our resource for Introductory Statistics includes answers to chapter exercises, as well as detailed information to walk you through the process step by step.
d to pull the mean in the opposite direction of the tail. B. The median will likely be larger because the extreme values in the right tail tend to pull the median in ...
This free textbook is an OpenStax resource written to increase student access to high-quality, peer-reviewed learning materials.
Access Intro Stats Plus NEW MyStatLab with Pearson eText -- Access Card Package 4th Edition Chapter 3 solutions now. Our solutions are written by Chegg experts so you can be assured of the highest quality!
tive to the data affect its value substantially. C. Changing particular data values affects its value substantially. D. An estimate of its value is extremely close to its actual value. - Answer-A. Extreme values (very large or small) relative to the data do not affect its value substantially. Note: A statistic is resistant if it is not sensitive to extreme values. 3.1 A histogram of a set of ...
Access Statistics 3rd Edition solutions now. Our solutions are written by Chegg experts so you can be assured of the highest quality!
This free textbook is an OpenStax resource written to increase student access to high-quality, peer-reviewed learning materials.
Access Elementary Statistics Plus NEW MyStatLab with Pearson eText -- Access Card Package 12th Edition Chapter 3.4 solutions now. Our solutions are written by Chegg experts so you can be assured of the highest quality!
Community questions. Learn statistics and probability—everything you'd want to know about descriptive and inferential statistics.
Probability and Statistics for the Liberal Arts I (MAT 121 ) 39 Documents University