
- Precise positioning in LaTeX beamer
It is easy to become frustrated with the automatic layout of LaTeX when preparing talks using the beamer package. Namely, LaTeX places images in an often unpredictable way, and sometimes it would be important to keep two images on consecutive slides precisely overlapping.
However, you can now forget all such worries. Here is a trick for taking total control of your slide contents.
The trick is based on the cunning use of LaTeX’s picture environment. Every slide becomes a big picture, inside which you can place formulas, text, images or videos as you wish using coordinates.
Let’s look at an example slide containing a title, an image and a text box. The image file is a modified version of the one created in https://blogs.helsinki.fi/smsiltan/?p=107
\documentclass[graphics]{beamer} \begin{document}
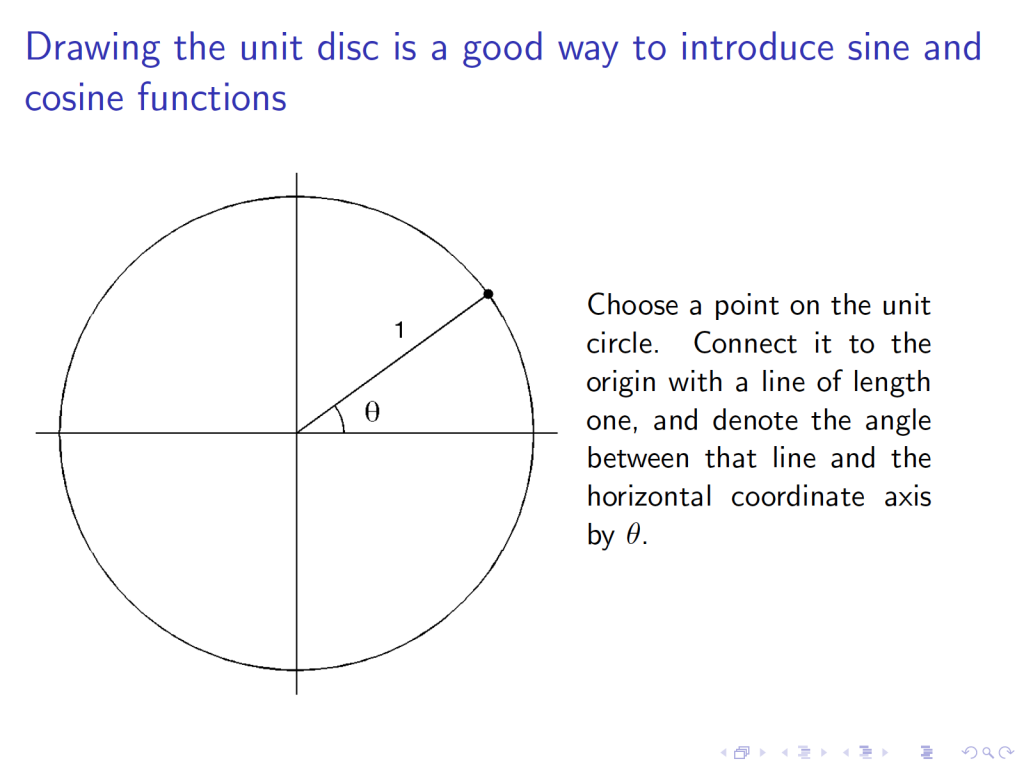
\begin{frame}{Drawing the unit disc is a good way to introduce sine and cosine functions} \begin{picture}(320,250) \put(-80,20){\includegraphics[height=8cm]{sincos2.png}} \put(180,180){\begin{minipage}[t]{0.4\linewidth} {Choose a point on the unit circle. Connect it to the origin with a line of length one, and denote the angle between that line and the horizontal coordinate axis by $\theta$.} \end{minipage}} \end{picture} \end{frame}
\end{document}
Here is the resulting slide:
Now we want two consecutive slides with some new structure building into the image above.
\begin{frame}{Now sine and cosine of angle $\theta$ can be found as the $x$ and $y$ coordinates of the chosen point at the unit circle} \begin{picture}(320,250) \put(-80,20){\includegraphics[height=8cm]{sincos3.png}} \put(180,180){\begin{minipage}[t]{0.4\linewidth} {Try drawing a similar figure with larger values of $\theta$. What happens to sine and cosine when you complete a full circle? Can you see from the figure which one of the functions $\sin$ and $\cos$ is odd and which one is even?} \end{minipage}} \end{picture} \end{frame}
The resulting two slides look like this:

Note that there is no movement in the placement of the circle. The colored parts just appear on top of the previous image when the slide is changed.
In case you wonder why I didn’t use .eps files above, let me point out the following situation. As far as I know, in current LaTeX you need to choose one of the following option regarding image file types: (1) All images in Encapsulated PostScript (.eps) format (2) All images anything else than .eps. Most presentations benefit from nice pictures that often come in other formats than .eps. It is easier to produce .png images from Matlab than to convert pixel images into .eps.
There is one remaining problem with the above approach. If the title of one page has more or less lines than another, the placement of the picture environment will change, and the overlapping of figures in consecutive slides will be lost. This can be overcome easily by adding an extra “ghost” line to a one-line title:
\begin{frame}{Too short title\\ \phantom{m}}


About Samuli Siltanen
3 responses to precise positioning in latex beamer.
Superb tip! Thank you!
Thank you so much for this help. Being a Latex novice, this post of yours surely helped me.
Thanks Sam! Very useful. LaTeX/Beamer was driving me nuts.
Leave a Reply Cancel reply
Your email address will not be published. Required fields are marked *
- Search for:
Recent Posts
- Tomography of lotus root
- How to make black&white images look good
- Basic Principles of Mathematical Programming
- Including movies in LaTeX beamer
Recent Comments
- S on Basic Principles of Mathematical Programming
- Xianghua on Including movies in LaTeX beamer
- Jinmin on Explaining sine and cosine visually
- Jim Bridgewater on Precise positioning in LaTeX beamer
- Korok Sengupta on Precise positioning in LaTeX beamer
- September 2016
- October 2012
- Beamer tricks
- General Advice
- Geometric illustration
- LaTeX tricks
- Matlab examples
- Visualization
- Entries feed
- Comments feed
- WordPress.org
No Search Results
- Inserting Images
- 1 Three ways to insert images (create LaTeX figures) in Overleaf
- 2 Introduction
- 3 The folder path to images
- 4 Changing the image size and rotating the picture
- 5.1 Wrapping text around figures
- 6.1 Captions
- 6.2 Labels and cross-references
- 7 Generating high-res and low-res images
- 8 Reference guide
- 9 Further reading
Three ways to insert images (create LaTeX figures) in Overleaf
The options are as follows:

- Copy and paste an image into Visual Editor or Code Editor .
- Use Code Editor to write LaTeX code that inserts a graphic and places it inside a figure environment.
Options 1 and 2 automatically generate the LaTeX code required to create your figure, but here we explore option 3, which provides the most flexibility.
Introduction
In this article we explain how to include images in the most common formats, how to shrink, enlarge and rotate them, and how to reference them within your document. We will start with an example to demonstrate how to import a picture.

Latex can not manage images by itself, so we need to use the graphicx package. To use it, we include the following line in the preamble: \usepackage{graphicx} .
The command \graphicspath{ {./images/} } tells L a T e X that the images are kept in a folder named images under the directory of the main document.
The \includegraphics{universe} command is the one that actually included the image in the document. Here universe is the name of the file containing the image without the extension, then universe.PNG becomes universe . The file name of the image should not contain white spaces nor multiple dots.
Note: The file extension is allowed to be included, but it's a good idea to omit it. If the file extension is omitted it will prompt LaTeX to search for all the supported formats. For more details see the section about generating high resolution and low resolution images .
Open an images example in Overleaf
The folder path to images
When working on a document which includes several images it's possible to keep those images in one or more separated folders so that your project is more organised.
The command \graphicspath{ {images/} } tells L a T e X to look in the images folder. The path is relative to the current working directory—so, the compiler will look for the file in the same folder as the code where the image is included. The path to the folder is relative by default, if there is no initial directory specified, for instance
This is a typically straightforward way to reach the graphics folder within a file tree, but can leads to complications when .tex files within folders are included in the main .tex file. Then, the compiler may end up looking for the images folder in the wrong place. Thus, it is best practice to specify the graphics path to be relative to the main .tex file , denoting the main .tex file directory as ./ , for instance:
as in the introduction.
The path can also be absolute , if the exact location of the file on your system is specified. For example, if you were working on a local LaTeX installation on your own computer:
Notice that this command requires a trailing slash / and that the path is in between double braces.
You can also set multiple paths if the images are saved in more than one folder. For instance, if there are two folders named images1 and images2 , use the command
Changing the image size and rotating the picture
If we want to further specify how L a T e X should include our image in the document (length, height, etc), we can pass those settings in the following format:

The command \includegraphics[scale=1.5]{overleaf-logo} will include the image overleaf-logo in the document, the extra parameter scale=1.5 will do exactly that, scale the image 1.5 of its real size.
You can also scale the image to a some specific width and height.

As you probably have guessed, the parameters inside the brackets [width=3cm, height=4cm] define the width and the height of the picture. You can use different units for these parameters. If only the width parameter is passed, the height will be scaled to keep the aspect ratio.
The length units can also be relative to some elements in document. If you want, for instance, make a picture the same width as the text:

Instead of \textwidth you can use any other default L a T e X length: \columnsep , \linewidth , \textheight , \paperheight , etc. See the reference guide for a further description of these units.
There is another common option when including a picture within your document, to rotate it. This can easily accomplished in L a T e X :

The parameter angle=45 rotates the picture 45 degrees counter-clockwise. To rotate the picture clockwise use a negative number.
Positioning
In the previous section was explained how to include images in your document, but the combination of text and images may not look as we expected. To change this we need to introduce a new environment .

The figure environment is used to display pictures as floating elements within the document. This means you include the picture inside the figure environment and you don't have to worry about it's placement, L a T e X will position it in a such way that it fits the flow of the document.
Anyway, sometimes we need to have more control on the way the figures are displayed. An additional parameter can be passed to determine the figure positioning. In the example, begin{figure}[h] , the parameter inside the brackets set the position of the figure to here . Below a table to list the possible positioning values.
| Parameter | Position |
|---|---|
| Place the float , i.e., at the same point it occurs in the source text (however, not at the spot) | |
| Position at the of the page. | |
| Position at the of the page. | |
| Put on a special for floats only. | |
| Override internal parameters LaTeX uses for determining "good" float positions. | |
| Places the float at precisely the location in the LaTeX code. Requires the package, though may cause problems occasionally. This is somewhat equivalent to . |
In the next example you can see a picture at the t op of the document, despite being declared below the text.

The additional command \centering will centre the picture. The default alignment is left .
Wrapping text around figures
It's also possible to wrap the text around a figure. When the document contains small pictures this makes it look better.

For the commands in the example to work, you have to import the wrapfig package . To use wrapfig , include the following line in the document preamble:
This makes the wrapfigure environment available and we can place an \includegraphics command inside it to create a figure around which text will be wrapped. Here is how we can specify a wrapfigure environment:
The position parameter has eight possible values:
| r | R | right side of the text |
| l | L | left side of the text |
| i | I | inside edge–near the binding (in a document) |
| o | O | outside edge–far from the binding |
The uppercase version allows the figure to float. The lowercase version means exactly here .
Now you can define the wrapfigure environment by means of the commands \begin{wrapfigure}{l}{0.25\textwidth} \end{wrapfigure} . Notice that the environment has two additional parameters enclosed in braces. Below the code is explained with more detail:
For a more complete article about image positioning see Positioning images and tables
Captioning, labelling and referencing
Captioning images to add a brief description and labelling them for further reference are two important tools when working on a lengthy text.
Let's start with a caption example:

It's really easy, just add the \caption{Some caption} and inside the braces write the text to be shown. The placement of the caption depends on where you place the command; if it's above the \includegraphics then the caption will be on top of it, if it's below then the caption will also be set below the figure.
Captions can also be placed right after the figures. The sidecap package uses similar code to the one in the previous example to accomplish this.

There are two new commands
You can do a more advanced management of the caption formatting. Check the further reading section for references.
Labels and cross-references
Figures, just as many other elements in a L a T e X document (equations, tables, plots, etc) can be referenced within the text. This is very easy, just add a \label to the figure or SCfigure environment, then later use that label to refer the picture.

There are three commands that generate cross-references in this example.
The \caption is mandatory to reference a figure.
Another great characteristic in a L a T e X document is the ability to automatically generate a list of figures . This is straightforward.

This command only works on captioned figures, since it uses the caption in the table. The example above lists the images in this article.
Important Note: When using cross-references your L a T e X project must be compiled twice, otherwise the references, the page references and the table of figures won't work—Overleaf takes care of that for you.
Generating high-res and low-res images
So far while specifying the image file name in the \includegraphics command we have omitted file extensions. However, that is not necessary, though it is often useful. If the file extension is omitted, LaTeX will search for any supported image format in that directory, and will search for various extensions in the default order (which can be modified).
This is useful in switching between development and production environments. In a development environment (when the article/report/book is still in progress), it is desirable to use low-resolution versions of images (typically in .png format) for fast compilation of the preview. In the production environment (when the final version of the article/report/book is produced), it is desirable to include the high-resolution version of the images.
This is accomplished by
- Not specifying the file extension in the \includegraphics command, and
- Specifying the desired extension in the preamble.
Thus, if we have two versions of an image, venndiagram.pdf (high-resolution) and venndiagram.png (low-resolution), then we can include the following line in the preamble to use the .png version while developing the report -
The command above will ensure that if two files are encountered with the same base name but different extensions (for example venndiagram.pdf and venndiagram.png), then the .png version will be used first, and in its absence the .pdf version will be used, this is also a good ideas if some low-resolution versions are not available.
Once the report has been developed, to use the high-resolution .pdf version, we can change the line in the preamble specifying the extension search order to
Improving on the technique described in the previous paragraphs, we can also instruct L a T e X to generate low-resolution .png versions of images on the fly while compiling the document if there is a PDF that has not been converted to PNG yet. To achieve that, we can include the following in the preamble after \usepackage{graphicx}
If venndiagram2.pdf exists but not venndiagram2.png, the file venndiagram2-pdf-converted-to.png will be created and loaded in its place. The command convert #1 is responsible for the conversion and additional parameters may be passed between convert and #1 . For example - convert -density 100 #1 .
There are some important things to have in mind though:
- For the automatic conversion to work, we need to call pdflatex with the --shell-escape option.
- For the final production version, we must comment out the \epstopdfDeclareGraphicsRule , so that only high-resolution PDF files are loaded. We'll also need to change the order of precedence.
Reference guide
L a T e X units and legths
| Abbreviation | Definition |
|---|---|
| A point, is the default length unit. About 0.3515mm | |
| a millimetre | |
| a centimetre | |
| an inch | |
| the height of an in the current font | |
| the width of an in the current font | |
| distance between columns | |
| width of the column | |
| width of the line in the current environment | |
| width of the page | |
| height of the page | |
| width of the text | |
| height of the text | |
| units of length in the environment. |
About image types in L a T e X
Further reading
For more information see
- Positioning images and tables
- Lists of tables and figures
- Single sided and double sided documents
- Lengths in LaTeX
- floatrow package for advanced caption managing of floating elements (tables and figures)
- sidecap package documentation, for side-figure captions
- epstopdf package documentation (EPS to PDF conversion)
- Documentation Home
- Learn LaTeX in 30 minutes
Overleaf guides
- Creating a document in Overleaf
- Uploading a project
- Copying a project
- Creating a project from a template
- Using the Overleaf project menu
- Including images in Overleaf
- Exporting your work from Overleaf
- Working offline in Overleaf
- Using Track Changes in Overleaf
- Using bibliographies in Overleaf
- Sharing your work with others
- Using the History feature
- Debugging Compilation timeout errors
- How-to guides
- Guide to Overleaf’s premium features
LaTeX Basics
- Creating your first LaTeX document
- Choosing a LaTeX Compiler
- Paragraphs and new lines
- Bold, italics and underlining
Mathematics
- Mathematical expressions
- Subscripts and superscripts
- Brackets and Parentheses
- Fractions and Binomials
- Aligning equations
- Spacing in math mode
- Integrals, sums and limits
- Display style in math mode
- List of Greek letters and math symbols
- Mathematical fonts
- Using the Symbol Palette in Overleaf
Figures and tables
- Positioning Images and Tables
- Lists of Tables and Figures
- Drawing Diagrams Directly in LaTeX
- TikZ package
References and Citations
- Bibliography management with bibtex
- Bibliography management with natbib
- Bibliography management with biblatex
- Bibtex bibliography styles
- Natbib bibliography styles
- Natbib citation styles
- Biblatex bibliography styles
- Biblatex citation styles
- Multilingual typesetting on Overleaf using polyglossia and fontspec
- Multilingual typesetting on Overleaf using babel and fontspec
- International language support
- Quotations and quotation marks
Document structure
- Sections and chapters
- Table of contents
- Cross referencing sections, equations and floats
- Nomenclatures
- Management in a large project
- Multi-file LaTeX projects
- Lengths in L a T e X
- Headers and footers
- Page numbering
- Paragraph formatting
- Line breaks and blank spaces
- Text alignment
- Page size and margins
- Multiple columns
- Code listing
- Code Highlighting with minted
- Using colours in LaTeX
- Margin notes
- Font sizes, families, and styles
- Font typefaces
- Supporting modern fonts with X Ǝ L a T e X
Presentations
- Environments
Field specific
- Theorems and proofs
- Chemistry formulae
- Feynman diagrams
- Molecular orbital diagrams
- Chess notation
- Knitting patterns
- CircuiTikz package
- Pgfplots package
- Typesetting exams in LaTeX
- Attribute Value Matrices
Class files
- Understanding packages and class files
- List of packages and class files
- Writing your own package
- Writing your own class
Advanced TeX/LaTeX
- In-depth technical articles on TeX/LaTeX
Get in touch
Have you checked our knowledge base ?
Message sent! Our team will review it and reply by email.
Email:
Positioning Images and Tables
Positioning images and tables in LaTeX involves determining their placement within the document. LaTeX provides various options for positioning figures and tables, allowing you to control where they appear relative to the surrounding text.
Introduction
Positioning Images and Tables is a crucial aspect of document layout in LaTeX. It enhances the overall quality, readability, and comprehension of the document. This section guides you on how to precisely position and align images and tables within your document, as well as learning about different placement options.
Strategically positioning images and tables offers several benefits, including:
- Highlighting important content to draw attention
- Supporting the text and facilitating reader comprehension
- Creating visually appealing layouts through well-placed elements
- Improving the aesthetic quality of the document and enhancing the overall user experience.
Image plecement
In a LaTeX document, images are treated as floating objects. This means that LaTeX automatically determines the best placement for the image.
By default:
- The horizontal alignment of images in LaTeX is set to left within the available space.
- The vertical alignment of images, on the other hand, depends on the surrounding text and the line spacing settings.
When positioning images within a document, LaTeX offers various options to control their placement. These options allow you to specify where the image should appear in relation to the surrounding text and other elements. Here are some common methods for positioning images:
The placement specifier of the figure environment
In LaTeX, the placement specifier is an optional argument that can be used with the figure environment to control where the figure is positioned on the page. The placement specifier is written inside square brackets immediately after the \begin{figure} command.
Here are the most commonly used placement specifiers:
| Placement Specifier | Description |
|---|---|
| Place the figure "here", i.e., at the current location in the text. This is the most restrictive option, as it only allows LaTeX to place the figure on the same page as the text | |
| Place the figure at the top of a page | |
| Place the figure at the bottom of a page | |
| Place the figure on a page that contains only floats (figures and tables) | |
| Override LaTeX's internal positioning rules |
Multiple placement specifiers can be combined, such as ht to allow LaTeX to place the figure either "here" or at the top of a page.
It is important to note that the placement specifier is only a suggestion to LaTeX, and it may not always be followed. LaTeX has its own set of rules and algorithms for placing figures on the page, and it may override the placement specifier if it cannot find a suitable location.
Here's an example of using a placement specifier in order to place the figure at the top of a page:
This example generates the following output:

In the next example, the placement specifier b is used to place the figure at the bottom of the page:

Controlling image position with [H] placement specifier of float package
To use the float package for controlling image placement and avoiding undesired floating behavior, you can follow these steps:
- Add the float package to your LaTeX document by including the following line in the preamble of your document:
- Specify the [H] placement specifier within the figure environment to override the default floating behavior. This will force the image to be placed exactly where it is defined in the document. For example:
Using the float package and specifying [H] as the placement specifier will ensure that the images are positioned exactly where they are defined, without floating.
The difference between the H option and h option
H option (provided by the float package) → It is a stronger placement specifier that stands for "Here, exactly here" . It overrides the default floating behavior and forces the image to be placed exactly at the location where it is defined in the document. The image will not float to other parts of the document, even if it results in a less optimal layout.
h option → It is a regular placement specifier that stands for "Here" . It suggests to LaTeX that the image should be placed at the current location if possible, but allows some flexibility for LaTeX to adjust the placement slightly for better overall layout.
Adjust the placement of images using the adjustbox package
The adjustbox package provides several commands and options to adjust the placement of images within a document.
In most document classes, the default alignment for an image included using \includegraphics is left-aligned, for example:
The image is left-aligned as expected:

You can use the center option in adjustbox to center the image horizontally within the text area:
This example generates the following output. Now the image is center-aligned:

Here are the available options:
| Option | Description |
|---|---|
| Aligns the image to the left side. | |
| Aligns the image to the right side. | |
| Centers the image horizontally. | |
| Aligns content to the outer margin (right margin for odd-numbered pages, left margin for even-numbered pages) in a two-sided document. | |
| Aligns content to the inner margin (left margin for odd-numbered pages, right margin for even-numbered pages) in a two-sided document. |
The adjustbox environment allows for additional customization of the image placement and properties, such as scaling, rotation, or padding, if desired.
Managing placement of multiple images in one figure
Managing the placement of multiple images in one figure enables organized and visually cohesive presentations.
The subfigure environment, which is part of the subcaption package, provides a convenient way to create subfigures within a larger figure in LaTeX. It allows you to divide a figure into multiple smaller parts, each with its own caption and label .
To use the subcaption package, include the following in your LaTeX document preamble:
Then, you can use the subfigure environment provided by the subcaption package to create subfigures within a larger figure, as demonstrated in the following example:

- \begin{subfigure}{width} → Specifies the width of the subfigure. You can provide a length value, such as '5cm' or '0.5\textwidth', to set the width of the subfigure relative to the parent figure's width.
- \subcaption → Used to specify the caption for the subfigure. Each subfigure can have its own caption.
- \label → Used to assign a label to the subfigure. Labels can be used for cross-referencing within the document.
- \captionsetup → Allows you to configure additional settings for the subcaption, such as formatting options, justification, and more.
Remember to compile your LaTeX document multiple times to ensure that the references and layout are properly updated.
Wrapping text around a figure using the wrapfig package
Wrapping text around a figure is a common technique used to integrate images seamlessly into the surrounding text. It allows the text to flow around the figure, creating a visually appealing layout. In LaTeX, you can achieve text wrapping using the wrapfig package.
To wrap text around a figure, you need to follow these steps:
- Load the wrapfig package in the preamble of your document:
- Insert the wrapfigure environment at the desired location in your document. The wrapfigure environment takes two required arguments:
<placement> → This mandatory argument specifies the placement of the figure relative to the text. Common options include:
- i → inside margin (near the binding edge of a two-sided document)
- o → outside margin
<width> → This mandatory argument sets the width of the wrapped figure. It can be specified using a length such as 5cm or a relative value such as 0.5\textwidth .
- Inside the wrapfigure environment, use the \includegraphics command to insert the image you want to wrap the text around.
Adjust the width of the image if necessary to fit within the specified width of the wrapfigure environment.
Optionally, provide a caption for the figure using the \caption command. This will add a caption below the wrapped figure.
Continue writing your text after the wrapfigure environment, and the text will flow around the figure according to the placement specified.
Here's a simple example demonstrating the usage of the wrapfigure environment:

In this example, the wrapfigure environment is used with the placement option r to wrap the text around the figure on the right side.
Table placement
Table placement is an essential aspect of creating well-organized and readable documents. Effectively positioning tables within your text helps present data in a clear and logical manner. Understanding table placement techniques ensures that your tables are strategically positioned to enhance readability, maintain document flow, and create visually appealing and informative documents.
The placement specifier of the table environment
In LaTeX, The table environment is a container that allows you to create and position tables within your document.
When using the table environment, you typically include the table content within the \begin{table} and \end{table} tags. This tells LaTeX that the enclosed content should be treated as a table:
The table environment acts as a floating environment, which means that LaTeX automatically determines the best position for the table based on various factors such as available space, page layout, and other content elements.
You can also guide the placement of the table using placement specifiers:
| Placement Specifier | Description |
|---|---|
| Place the table approximately at the current position. | |
| Position the table at the top of a page. | |
| Position the table at the bottom of a page. | |
| Places the table on a separate page dedicated to floats (tables and figures) only. | |
| Overrides certain internal parameters to force LaTeX to try harder to place the table according to your preferences. |
For example the following table is placed at the current position using the h placement specifier:

In the following example the table is placed at the top of the page using the t placement specifier:

Controlling table position with [H] placement specifier of float package
The H specifier is not part of the standard LaTeX, but it is provided by the float package. It forces the table to be placed exactly at the position in the source code, overriding its default floating behavior.
To use the H specifier of the float package for precise table placement:
- Inside the table environment, specify the H specifier within square brackets. For example:
By using the H specifier, you are instructing LaTeX to place the table exactly where it is defined in the source code, overriding any other placement options.
Table placement with the placeins package
The placeins package provides additional control over the placement of floats, such as tables and figures.
It offers the \FloatBarrier command, which creates a barrier that prevents floats from floating beyond that point in the document.
The main purpose of the placeins package is to help maintain the placement of floats within specific sections or chapters , ensuring that they do not float to a different section or chapter. This can be useful when you want to keep related content together and improve the organization and readability of your document.
To use the placeins package, you need to include the following line in the preamble of your LaTeX document:
Then you can place the \FloatBarrier command at specific locations in your document where you want to restrict the floating behavior of floats.
Here's an example of how to use the \FloatBarrier command:

In this example, the \FloatBarrier command is placed after the table environment. It creates a barrier that prevents any floats (tables or figures) from floating past it. In this case, it ensures that the table is placed before the "Analysis" section starts. This can be useful when you want to restrict the floating of tables or figures within specific sections of your document.
Wrapping text around a table using the wrapfig package
Wrapping text around a table refers to the technique of aligning text in a way that it flows around the table instead of creating a separate space for the table. This can make the document layout more visually appealing and optimize the use of space.
To achieve text wrapping around a table, you can use the wraptable environment provided by wrapfig package:
- Define the wrapping region using the wraptable environment:
Replace placement with r for right alignment or l for left alignment. Specify the desired width of the table.
- (Optional) Adjust the table and text placement using lineheight:
You can use the lineheight argument to specify the number of lines the table should span vertically. This helps prevent the table from overlapping with the text.
- Add the table content: Inside the wraptable environment, use the regular tabular or table environment to define your table's content. For example:
- Customize the appearance: You can apply additional formatting and styling to the table, just like in a regular table. For example, you can add borders, colors, or adjust column widths using the usual table formatting commands.
By following these steps, the table will be wrapped with text flowing around it, creating an integrated layout.
Here's an example of wrapping text around a table using the wrapfig package:

- Stack Overflow for Teams Where developers & technologists share private knowledge with coworkers
- Advertising & Talent Reach devs & technologists worldwide about your product, service or employer brand
- OverflowAI GenAI features for Teams
- OverflowAPI Train & fine-tune LLMs
- Labs The future of collective knowledge sharing
- About the company Visit the blog
Collectives™ on Stack Overflow
Find centralized, trusted content and collaborate around the technologies you use most.
Q&A for work
Connect and share knowledge within a single location that is structured and easy to search.
Get early access and see previews of new features.
Beamer: How to show images as step-by-step images
I'm trying to make a presentation using the Beamer class. I want to show a simple list of images, one by one in one frame, just like when you use itemize<+-> .
I have no problem showing the images one-by-one, but the images shifts every time I insert a new image. How do I solve this - From my perspective there must be a simple solution, without specifying the absolute placement of the images.
- Would you like to show all the images in a single frame, or each image in its own frame, but aligned with the images shown before? – Sven Marnach Commented Jan 13, 2011 at 17:41
- In a single frame... So the images do not shifts as they are uncovered – aagaard Commented Jan 13, 2011 at 18:05
- 4 You can find an entire community on the TeX StackExchange , where no TeX-related question is too small. See this question . – Matthew Leingang Commented Jan 13, 2011 at 18:38
- Thanks for the link! I didn't know that existed. – aagaard Commented Jan 13, 2011 at 18:47
5 Answers 5
You can simply specify a series of images like this:
This will produce three slides with the images A to C in exactly the same position.
- 5 I also tried this with some success, but instead of "popping up", I would rather have the content allocated on the frame from the start. This is makes the other content on the slide move, when it appears. – aagaard Commented Jan 13, 2011 at 19:20
- 1 This one doesn't work if the images are individually wrapped in centerline . If they're all wrapped in a single centerline then it works. – kennyB Commented May 28, 2019 at 20:45
- Put a % at the end of each line such that the images don't move (See Subhadeep's post below) – Mathi Commented Feb 6, 2023 at 1:56
I found a solution to my problem, by using the visble-command.
- visible is superior to onslide when it comes to figures, because onslide tries to transparentize a figure, but it cannot! – Sibbs Gambling Commented Mar 13, 2015 at 8:27
- 3 I think it is not needed to use \begin{figure} in most cases like this. You can just put the \includegraphics part, at least that is what I prefer. Do you intend to have numbered figures in a beamer slideshow? If yes, you are more fastidious than I :) – pauljohn32 Commented Feb 5, 2018 at 23:08
- 1 Nice solution, as space for figure will be taken into account in previous overlays, while it does not seem to be the case with the \includegraphics<1>{A} approach. Worth emphasising in your post? – Matifou Commented Feb 10, 2019 at 23:23
- It worked perfectly for my case: 3 images with space between each other (\hfill-IMG1-\hfill-IMG2-\hfill-IMG3-\hfill). All the other solution makes the images move. – Chutlhu Commented Nov 19, 2020 at 10:19
The % is important. This will keep all the images fixed.
- 2 Shouldn't this be a comment to Svante's answer? – Cyriac Antony Commented Jan 4, 2020 at 8:28
- 1 I found the '%' essential for keeping the images fixed; is it a beamer-specific of latex-generic feature? – bricoletc Commented Apr 28, 2021 at 12:31
- @bricoletc I suspect that this is LaTeX-wide. The percentage sign tries to get rid of an extra whitespace that would be there due to the newline character. In most situations the extra whitespace is helpful, e.g., mid-sentence line break. In this case it's a nuisance. – Frenzy Li Commented Jul 30, 2021 at 0:30
- Isn't % supposed to start a comment? Why does it change the content here? – DSM Commented Apr 17 at 13:24
This is what I did:
This is a sample code I used to counter the problem.
Your Answer
Reminder: Answers generated by artificial intelligence tools are not allowed on Stack Overflow. Learn more
Sign up or log in
Post as a guest.
Required, but never shown
By clicking “Post Your Answer”, you agree to our terms of service and acknowledge you have read our privacy policy .
Not the answer you're looking for? Browse other questions tagged image latex beamer or ask your own question .
- The Overflow Blog
- The hidden cost of speed
- The creator of Jenkins discusses CI/CD and balancing business with open source
- Featured on Meta
- Announcing a change to the data-dump process
- Bringing clarity to status tag usage on meta sites
- What does a new user need in a homepage experience on Stack Overflow?
- Feedback requested: How do you use tag hover descriptions for curating and do...
- Staging Ground Reviewer Motivation
Hot Network Questions
- Is there a way to prove ownership of church land?
- Where is this railroad track as seen in Rocky II during the training montage?
- Swapping touch digitizer from one Android phone to another
- Sum[] function not computing the sum
- Textile Innovations of Pachyderms: Clothing Type
- Colossians 1:16 New World Translation renders τα πάντα as “all other things” but why is this is not shown in their Kingdom Interlinear?
- How to clean a female disconnect connector
- Is "She played good" a grammatically correct sentence?
- Integrity concerns
- Looking for the name of a possibly fictional science fiction TV show
- What are the most common types of FOD (Foreign Object Debris)?
- How to fold or expand the wingtips on Boeing 777?
- Has anyone returned from space in a different vehicle from the one they went up in? And if so who was the first?
- Nothing to do with books but everything to do with "BANGS"!
- Understanding the parabolic state of a quantum particle in the infinite square well
- Is this host and 'parasite' interaction feasible?
- What qualifies as a Cantor diagonal argument?
- Circut that turns two LEDs off/on depending on switch
- Book about a wormhole found inside the Moon
- How to simplify input to a table with many columns?
- What's the purpose of scanning the area before opening the portal?
- What is the optimal number of function evaluations?
- Minimal permutation degree of the dihedral group
- Applying to faculty jobs in universities without a research group in your area
Precise positioning of an image in Beamer
1. Absolute coordinates of a frame
The following illustration shows different coordinates of a frame that can be used for absolute positioning of an image using TikZ , check this tutorial for more details!
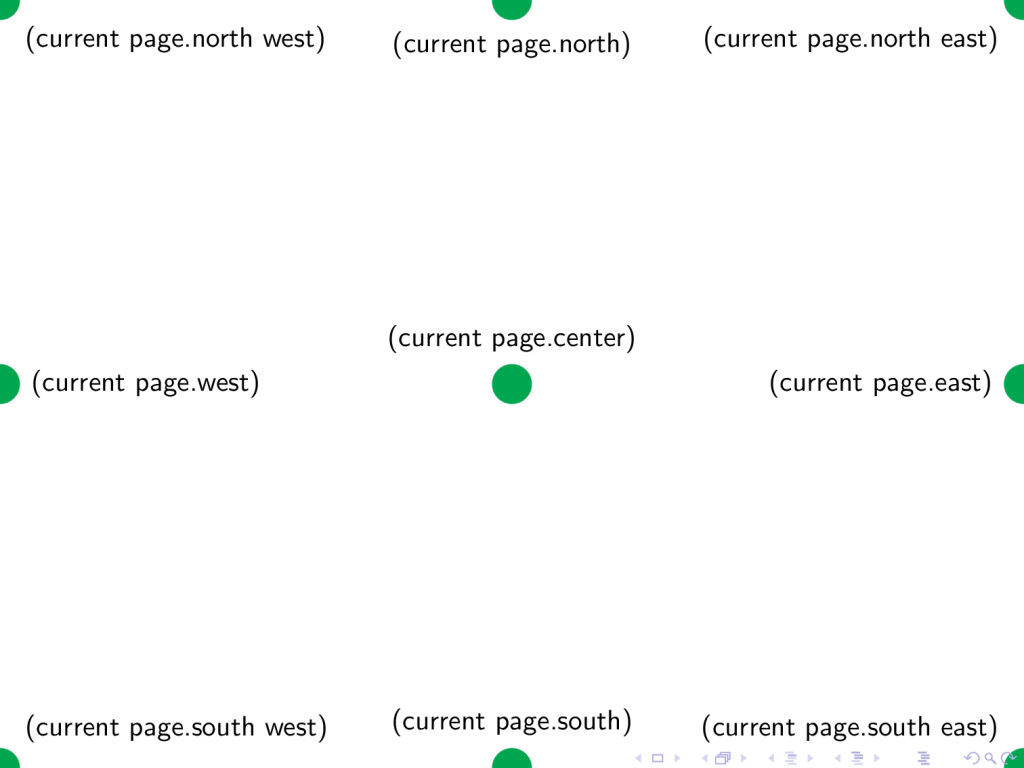
Moreover, we can access the frame border using angles (this has been used for logo positioning in this lesson !) as shown below:

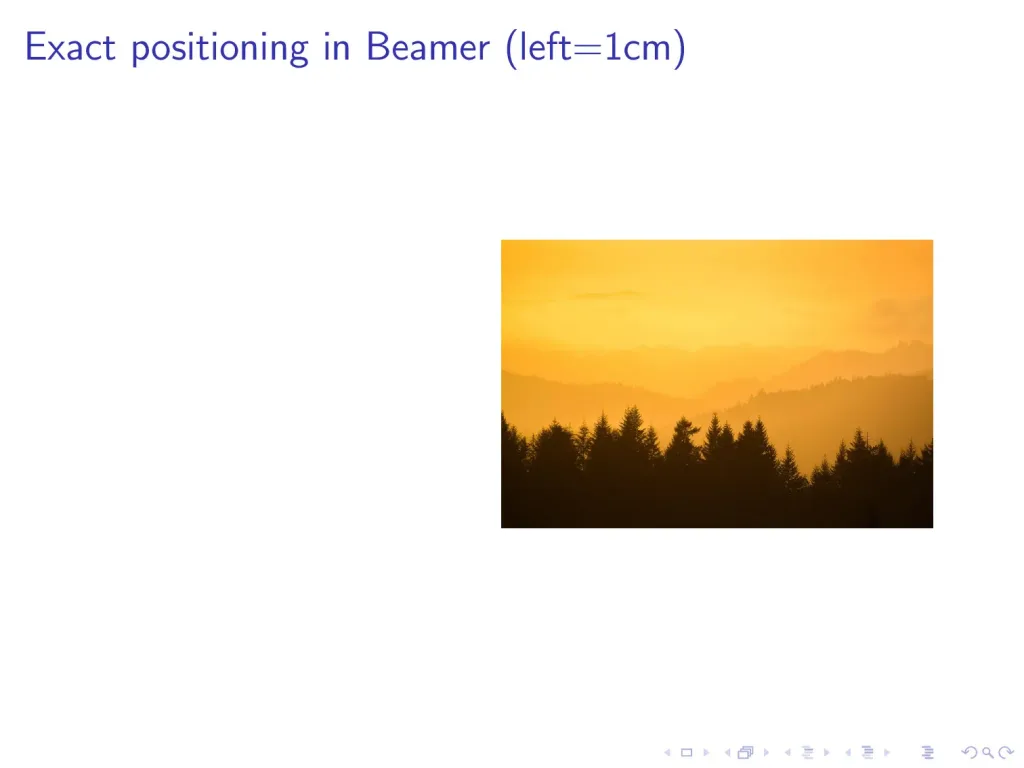
2. Exact image positioning in Beamer
The following code highlights the idea of absolute positioning of an image in Beamer using TikZ package ( download nature3.jpg ):
- We loaded the TikZ package using the command: \usepackage{tikz}
- We created a TikZ environment inside a frame that we would like to add an image to it. This is achieved by \begin{tikzpicture}[remember picture, overlay] ... \end{tikzpicture}
- The parameters of the TikZ environment [remember picture, overlay] allows us to work on the frame and use absolute positioning.
- We created a node at the center of the frame, (current page.center) , which has an image a content.
Compiling the above code yields:

3. Use left, right, below and above for relative positioning
Now, once you add an image at an absolute position of the frame, you can move it to different directions with respect to the absolute coordinate by adding one of these options: left , right , below or above to the node command!
So to solve the above issue, we can add left option , relative to (current page.east) , to the node command:
This code yields the following output:

You can also specify how much left distance by using left=<value> instead of left . Consider the above code with left=1cm , we get the following:
You can do the same with right, below and above parameters!
If you find the tutorial useful, PLEASE share it with your colleagues!
Positioning Figures in LaTeX
Last updated: March 18, 2024

- LaTeX Figures
Baeldung Pro comes with both absolutely No-Ads as well as finally with Dark Mode , for a clean learning experience:
>> Explore a clean Baeldung
Once the early-adopter seats are all used, the price will go up and stay at $33/year.
1. Introduction
In this tutorial, we’ll show how figures can be positioned and scaled in LaTeX according to the needs of the document. We’ll show that the basic command that needs to be used is \includegraphics , which belongs to the graphicx package.
We’ll use a picture of the St. Honorat Monastery in France, which is free to use at the U.S. Library of Congress , as our example figure and will illustrate our techniques using a set of self-contained examples.
2. Including a Figure
We’ll assume the figure is stored in the file monastery.jpg . This can be included in a document as follows:
This yields the following result:
Lorem ipsum dolor…, etc., is dummy Latin text that is traditionally popular for use in text formatting examples.
2.1. Scaling a Figure
We now show how the above figure can be scaled by 50%:
This yields the same result as before, but with the figure scaled by 0.5:
2.2. Cropping
Let’s crop the figure, that is, remove slabs of the figure on its four borders. This is done by supplying the argument [left bottom right top] to the \includegraphics command . In our example we use left=1cm, bottom=2.7cm, right=2.5cm and top=1cm. We’ve used “cm” (centimeters) as our units of measurement but could have used “in” (inches) or any other units acceptable to LaTeX. We must remember to use the “ trim= ” and “ clip ” keywords as shown:
This results in a figure cropped to our specifications:
2.3. Specifying the Height or Width of a Figure
In some situations, we need to scale the figure to a specific width or height. Here’s an example:
We can see that the aspect ratio of the figure remains unchanged, regardless of width or height:
4. Centering Figures
We often need to center figures with respect to the text of a document. We’ll show two techniques for this, \centering and \begin{center}…\end{center} :
We notice that \centering results in the figure being tightly bound to the text, while the \begin{center} … \end{center} approach leads to more relaxed spacing:
5. Combining the Techniques
We’ll now present an elaborate example that combines most of the techniques described above. Here, we first want the figure cropped into a thin vertical strip and centered below the text. We then want the figure cropped into a horizontal strip and expanded to the width of the text:
We can see that the end result satisfies our requirements:
6. Inserting Figures Inside Text
Sometimes we’d like to insert figures inside text. This could be for the sake of appearance or for saving space. We can do this using the wrapfigure command from the wrapfig package. We must tell wrapfigure whether the figure is to be put on the right {r} or left {l} and also how much space to set aside for the figure, for example {0.5\linewidth} . In the following, the \blindtext command from the blindtext package is used to generate a large amount of dummy text:
We can use this technique to produce documents that are compact and pleasing to the eye:
7. Conclusion
In this article, we’ve presented several techniques for positioning figures in a LaTeX document. We’ve included examples of scaling, cropping, and centering. We’ve presented our material as a set of brief, self-contained examples that will allow the reader to experiment with these techniques.
The power of LaTeX in producing documents with figures is vast and extends well beyond these introductory examples. Nonetheless, the material presented gives the reader the tools to produce fairly elaborate documents.
LaTeX-Tutorial.com
Insert an image in latex – adding a figure or picture.
Learn how to insert images and caption them. Examples for a single figure, and multiple figures next to each other, using the subfigure environment.
Captioned images / figures in latex, image positioning / setting the float, multiple images / subfigures in latex.
From time to time, it’s necessary to add pictures to your documents. Using LaTeX all pictures will be indexed automatically and tagged with successive numbers when using the figure environment and the graphicx package .
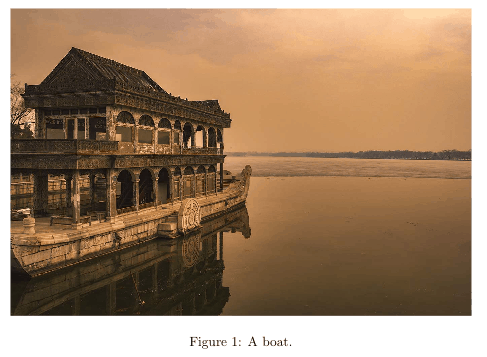
The code above will create the following pdf:
The figure environment takes care of the numbering and positioning of the image within the document. In order to include a figure, you must use the \includegraphics command. It takes the image width as an option in brackets and the path to your image file. As you can see, I put \linewidth into the brackets, which means the picture will be scaled to fit the width of the document. As a result smaller pictures are upscaled and larger pictures downscaled respectively. As I mentioned before the brackets contain the path to the image. In this case the image is stored in the same directory as my .tex file, so I simply put boat.jpg here to include it. For large documents, you probably want to store image files in a different folder, say we created a folder images , then we would simply write images/boat.jpg into the braces. In the next command we set a \caption , which is the text shown below the image and a \label which is invisible, but useful if we want to refer to our figure in our document. You can use the \ref command to refer to the figure (marked by label) in your text and it will then be replaced by the correct number. LaTeX is smart enough to retrieve the correct numbers for all your images automatically. Note that you will need to include the graphicx package in order to use this code.
At some point, you will notice that the figure doesn’t necessarily show up in the exact place as you put your code in the .tex file. If your document contains a lot of text, it’s possible that LaTeX will put the picture on the next page, or any other page where it finds sufficient space. To prevent this behavior, it’s necessary to set the float value for the figure environment.
Setting the float by adding [h!] behind the figure environment \begin tag will force the figure to be shown at the location in the document. Possible values are:
- h (here) – same location
- t (top) – top of page
- b (bottom) – bottom of page
- p (page) – on an extra page
- ! (override) – will force the specified location
However, I have only used the [h!] option so far. The float package (\usepackage{float}) allows to set the option to [H] , which is even stricter than [h!].
Sometimes when writing a document, adding single images is not optimal, especially when the reader is supposed to compare several results or graphs. In such situations, it might be necessary to use a different environment, called subfigure . The subfigure environment allows you to place multiple images at a certain location next to each other and the usage is pretty straightforward.
First you need to add the subcaption package to your preamble:
Next, you need to add multiple subfigure environments within a figure environment.
This will show two pictures next to each other in your document, like this:

If you look closely, you will see, that I’ve set the width of the image manually:
and even though there are two images aligned next to each other, their widths are both set to 0.4, yet they fill up the whole space. You should always set this value to .1 less than you expect. If you want to align three images next to each other, you should consecutively add three subfigures, each with a 0.2\linewidth. I suggest, if you need some other arrangement, you simply play around with the width factor until you are satisfied with the result. A more elaborate example with multiple rows and columns could look like this:
This will print out the following figure in your document:

- Use the graphicx package and figure environment to embed pictures
- Pictures will be numbered automatically
- Change the width of your image by using \includegraphics[width=\linewidth]{}
- Refer to pictures in your document by setting a \label and using the \ref tag
- Set the position of your image by adding a float option such as [h!]
- If you want to show multiple figures next to each other, use the subcaption package and the subfigure environment
Next Lesson: 06 Table of Contents
We love good questions
Skip to content
LaTeX.org on Twitter - follow us
- Unanswered topics
- Active topics
- Impressum and Privacy Policy
- About LaTeX
- Board index LaTeX Graphics, Figures & Tables
LaTeX forum ⇒ Graphics, Figures & Tables ⇒ Absolute positioning of figure
Absolute positioning of figure.
Post by CJFugate » Thu Oct 04, 2012 8:37 pm
Recommended reading 2024:

Post by localghost » Thu Oct 04, 2012 8:46 pm
- UK TeX FAQ – Figure (or table) exactly where I want it
Return to “Graphics, Figures & Tables”
- Text Formatting
- Graphics, Figures & Tables
- Math & Science
- Fonts & Character Sets
- Page Layout
- Document Classes
- General
- LaTeX's Friends
- BibTeX, biblatex and biber
- MakeIndex, Nomenclature, Glossaries and Acronyms
- Conversion Tools
- Viewers for PDF, PS, and DVI
- XeTeX
- Others
- LaTeX Distributions
- Decision Guidance
- MiKTeX and proTeXt
- TeX Live and MacTeX
- LaTeX Editors
- AUCTeX
- Kile
- LEd
- LyX
- Scientific Word/Workplace
- Texmaker and TeXstudio
- TeXnicCenter
- Announcements
- General
- Templates, Wizards & Tools
- Feature Suggestions
- Development
- TeXShop
- TeXworks
- WinEdt
- WinShell
- LaTeX Templates
- Articles, Essays, and Journal Templates
- Theses, Books, Title pages
- Letters
- Presentations and Posters
- Curricula Vitae / Résumés
- Assignments, Laboratory books and reports
- Calendars and Miscellaneous
- LaTeX Community
- Announcements
- Community talk
- Comments & Wishes
- New Members
- LaTeX Books
- LaTeX Beginner's Guide
Who is online
Users browsing this forum: No registered users and 9 guests
- Recommended reading 2024: LaTeXguide.org • LaTeX-Cookbook.net • TikZ.org
- News and Articles
- Unread posts
- Other LaTeX forums
- TeXwelt (deutsch)
- goLaTeX (deutsch)
- TeXnique (français)
- Board index
- All times are UTC+02:00
- Delete all board cookies
- Text Formatting
- Graphics, Figures & Tables
- Math & Science
- Fonts & Character Sets
- Page Layout
- Document Classes
- BibTeX, biblatex and biber
- MakeIndex, Nomenclature, Glossaries and Acronyms
- Conversion Tools
- Viewers for PDF, PS, and DVI
- Decision Guidance
- MiKTeX and proTeXt
- TeX Live and MacTeX
- Scientific Word/Workplace
- Texmaker and TeXstudio
- Announcements
- Templates, Wizards & Tools
- Feature Suggestions
- Development
- Articles, Essays, and Journal Templates
- Theses, Books, Title pages
- Presentations and Posters
- Curricula Vitae / Résumés
- Assignments, Laboratory books and reports
- Calendars and Miscellaneous
- Community talk
- Comments & Wishes
- New Members
- LaTeX Beginner's Guide
Stack Exchange Network
Stack Exchange network consists of 183 Q&A communities including Stack Overflow , the largest, most trusted online community for developers to learn, share their knowledge, and build their careers.
Q&A for work
Connect and share knowledge within a single location that is structured and easy to search.
How to place figure in the absolute top position?
I'm using IEEE conference style spconf.sty
My question is, how to place a figure in the absolute top position in a page, and leaving no space on the top or left or right.
For example, the figure below:
the red area is the original figure.

The current code for the figure is:
- If this is for a conference, don't do it. They may decide to add a header. If not, you can use \makebox[\textwidth][c]{\vskip*{\dimexpr -1in-\topmargin-\headheight-\headsep}...} – John Kormylo Commented Apr 18, 2018 at 15:00
- @JohnKormylo This is for conference, but they wont't add anything in the header, so it is okay. Where should I insert this code? – null Commented Apr 19, 2018 at 12:23
There appears to be a slight gap left. It is smaller than \topskip or \dblfloatsep or \dbltextfloatsep , so it probably isn't deliberate.
- Really thanks, this could work.. BTW, how to make it to show on the bottom of the page? – null Commented Apr 20, 2018 at 13:34
- The dblfloatfix package will enable [b]. You will also have to move the \vspace to the bottom of the figure* environment. – John Kormylo Commented Apr 20, 2018 at 14:44
You must log in to answer this question.
Not the answer you're looking for browse other questions tagged floats ieee-style ieeeconf ..
- The Overflow Blog
- The hidden cost of speed
- The creator of Jenkins discusses CI/CD and balancing business with open source
- Featured on Meta
- Announcing a change to the data-dump process
- Bringing clarity to status tag usage on meta sites
Hot Network Questions
- Integrity concerns
- Plausible orbit to have a visible object slowly circle over the night sky
- Improper Subpanel Concerns
- How does a miner create multiple outputs in a coinbase transaction?
- Visual assessment of scatterplots acceptable?
- Book about a wormhole found inside the Moon
- How to extrude a profile along multiple curves keeping tilt equal between instances and sane normals?
- How high does the ocean tide rise every 90 minutes due to the gravitational pull of the space station?
- Understanding the parabolic state of a quantum particle in the infinite square well
- How cheap would rocket fuel have to be to make Mars colonization feasible (according to Musk)?
- Is my magic enough to keep a person without skin alive for a month?
- How to make my latex code to be continuously showing my big table in the next pages
- Why does the guardian who admits guilt pay more than when his guilt is established by witnesses?
- What are the steps to write a book?
- Would two switches in parallel in the same box meet code?
- Humans are forbidden from using complex computers. But what defines a complex computer?
- Why are there both "was" and "wozu" in this sentence: "Auf jeden Fall ist es mir vollkommen egal, was Sie denken, wozu Sie ein Recht hätten!"?
- Can you move between an attack and the attack granted by Horde Breaker?
- Replacing jockey wheels on Shimano Deore rear derailleur
- Why a minus sign is often put into the law of induction for an inductor
- Does Psalm 127:2 promote laidback attitude towards hard work?
- Can population variance from multiple studies be averaged to use for a sample size calculation?
- Best approach to make lasagna fill pan
- Using NDSolve to solve the PDEs and their reduced ODEs yields inconsistent results
COMMENTS
@fqq OP asked for absolute positioning, which means relative to the paper edges. In the way you suggest, even with a zero-size picture, (200,-300) would still be relative to the reference point of picture at the time of its use, which is, at best, the upper left corner of the text area. - AlexG
Positioning images and tables
15. beamer doesn't really support floats as they don't make sense in a presentation. The figure environment is allowed but doesn't really do much. \vspace*{2cm} \hspace*{3cm}\includegraphics[width=0.15\textwidth,natwidth=69,natheight=87]{images/logo.jpg} would probably do what you want, adjust the lengths to fit.
Figures in Beamer - A detailed tutorial
I want to have the picture exactly in a specific position in my text. I use the commands below \begin{enumerate} \item T.D. Lee(1957 Physics Nobel Laureate) \begin{figure} \begin{center} \includegraphics[scale=0.5]{TdLee.eps} \end{center} \end{figure} I have many figures like this. What happens is that I see figures and items in different order.
Precise positioning in LaTeX beamer. Posted on October 12, 2012 by Samuli Siltanen. It is easy to become frustrated with the automatic layout of LaTeX when preparing talks using the beamer package. Namely, LaTeX places images in an often unpredictable way, and sometimes it would be important to keep two images on consecutive slides precisely ...
Part 1 | Part 2 | Part 3 | Part 4 | Part 5. Author: Josh Cassidy (August 2013) This five-part series of articles uses a combination of video and textual descriptions to teach the basics of creating a presentation using the LaTeX beamer package.These tutorials were first published on the original ShareLateX blog site during August 2013; consequently, today's editor interface (Overleaf) has ...
To include shifts directly in the options part of the \includegraphics[options]{graphic.pdf} part of the command, a more straight forward way is the `trim=left bottom right top` option. Here, left, bottom, right, and top are units of length, which trim the graphic for positive values and add space for negative values. So to move to the right by 5cm and 1 cm from the top, you would do:
LaTeX/Floats, Figures and Captions
Inserting Images - Overleaf, Online LaTeX Editor
Positioning Images and Tables
latex - Beamer: How to show images as step-by-step images
In this short tutorial, we are going to see how to put an image in an arbitrary position of a frame using coordinates. To do so, we will use once again the tikz package. 1. Absolute coordinates of a frame. The following illustration shows different coordinates of a frame that can be used for absolute positioning of an image using TikZ, check this tutorial for more details!
This is done by supplying the argument [left bottom right top] to the \includegraphics command. In our example we use left=1cm, bottom=2.7cm, right=2.5cm and top=1cm. We've used "cm" (centimeters) as our units of measurement but could have used "in" (inches) or any other units acceptable to LaTeX. We must remember to use the "trim ...
Force figure placement in text - TeX
Insert an image in LaTeX - Adding a figure or picture
Hi kaku92, welcome to the forum! And thank you for your suggestion. I suggest allowing more positions, if possible "here" would be taken anyway, but so top/bottom/page would not be forbidden: \begin{figure}[!htbp] This is the most flexible one. Furthermore, the figure should not be too wide or to high to fit at all, otherwise placement would be ...
How to use the placement options [t], [h] with figures?
Absolute positioning of figure. Postby CJFugate » Thu Oct 04, 2012 6:37 pm. I've only used floats to postion my figures. One of my figures looks something like this is my document -. which was cut in half by the figure and continues below the figure. I would like to push the figure to the top of the page so it doesn't cut that sentence in half.
5. Save this answer. Show activity on this post. \includegraphics has no positional logic it is just positioned like a letter and you can adjust it in the same way \hspace*{-2cm}\includegraphics{...} will move it 2cm to the left. Share. Improve this answer. Follow this answer to receive notifications.
The current code for the figure is: \centering. \includegraphics[width=0.8\textwidth]{figures/aaa} \caption{aaa} \label{aaa} If this is for a conference, don't do it. They may decide to add a header. If not, you can use \makebox[\textwidth][c]{\vskip*{\dimexpr -1in-\topmargin-\headheight-\headsep}...} @JohnKormylo This is for conference, but ...